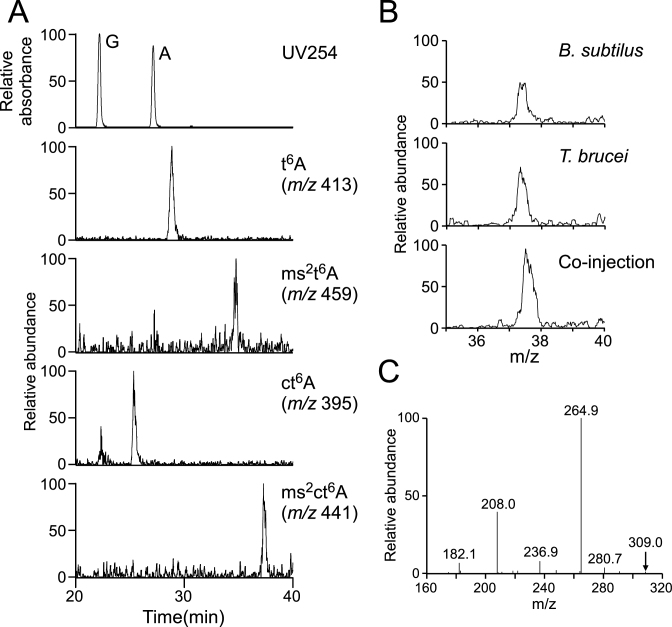
Figure 6.
Detection of ms2ct6A in T. brucei tRNAs. (A) RPC/ESI-MS nucleoside analyses of total RNAs from T. brucei. Top panel shows a UV trace at 254 nm. Panels second from the bottom show mass chromatograms corresponding to the proton adducts of t6A (m/z 413), ms2t6A (m/z 459), ct6A (m/z 395) and ms2ct6A (m/z 441), respectively. (B) Mass chromatograms showing the proton adduct of ms2ct6A (m/z 441) in total nucleosides of B. subtilis (top panel), T. brucei (middle panel) and the co-injection fraction (bottom panel) obtained by RPC/ESI-MS. (C) CID spectrum of BH2+ of ms2ct6A from T. brucei. The parent ion for CID is indicated by an arrow.

