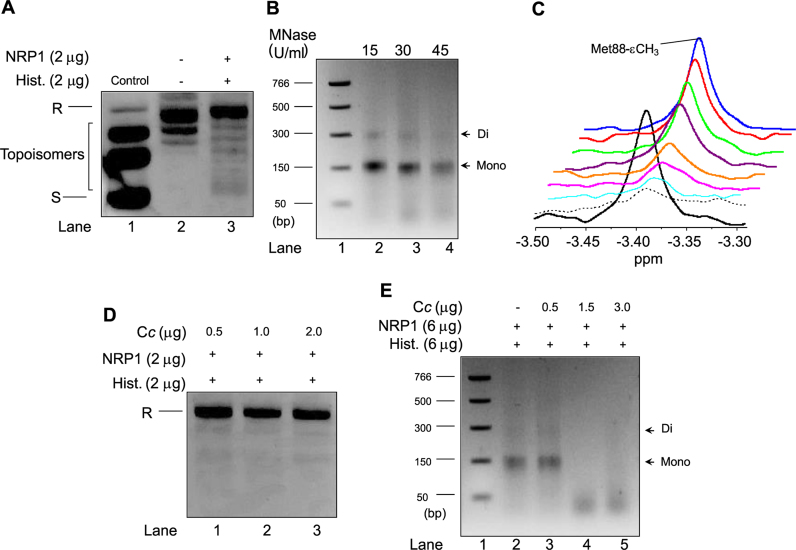
Figure 3.
Nucleosome assembly activity of NRP1 and its inhibition by Cc. (A) Plasmid supercoiling analysis was carried out by mixing 2 μg of NRP1 with 200 ng of relaxed plasmid after being treated with Topo I and incubated with 2 μg of HeLa core histones. Relaxed and supercoiled forms of circular DNA plasmid are indicated as R and S, respectively. Lane 1 (control) shows a supercoiled, untreated DNA plasmid, whereas lane 2 corresponds to the DNA plasmid relaxed by Topo I. (B) MNase assay was performed by mixing 6 μg of NRP1 with 600 ng of relaxed plasmid after being treated with Topo I and incubated with 6 μg of HeLa core histones. Plasmid DNA was digested with MNase (15, 30 or 45 U/ml; lanes 2–4). Lane 1 indicates a DNA ladder marker and the size of each band is represented on the left. DNA fragments that correspond to mono- and di-nucleosomes are indicated by arrows on the right. (C) 1D 1H NMR spectra monitoring the Met-88-CH3 signal of reduced Cc in the presence of NRP1 and histones. Details of superimposed 1D 1H NMR spectra of 13 μM reduced Cc either free (black) or bound to 6.5 μM NRP1 (dashed) following addition of increasing concentrations of calf thymus histones (80 μg [light blue], 100 μg [pink], 112 μg [orange], 125 μg [purple], 135 μg [green], 150 μg [red] and 300 μg [blue]). (D) Plasmid supercoiling analysis was carried out as in A, but in the presence of Cc at increasing concentrations (0.5, 1 and 2 μg [lanes 1–3]). Relaxed form of circular DNA plasmid is indicated as R. (E) MNase assay was performed as in B, in the absence (lane 2) and in the presence of Cc at increasing concentrations (0.5, 1.5 and 3 μg [lanes 3–5]). Plasmid DNA was digested with 30 U/ml. Lane 1 indicates a DNA ladder marker and the size of each band is represented on the left. DNA fragments that correspond to mono- and di-nucleosomes are indicated by arrows on the right.

