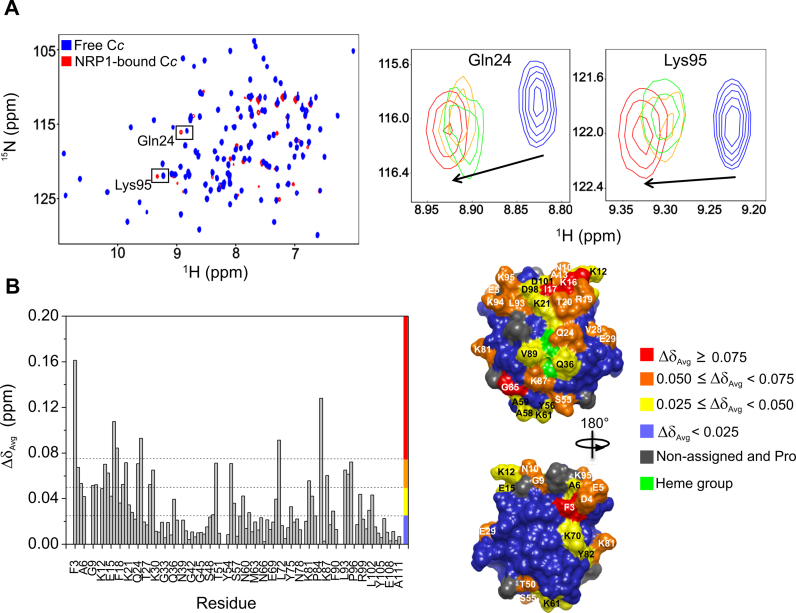
Figure 4.
NMR titrations of 15N-labeled reduced Cc with NRP1. (A) Left: Superimposed [1H, 15N] 2D HSQC spectra of 15N-labeled Cc, either free or bound to NRP1, at Cc:NRP1 molar ratio of 1:0.5. Right: Details of the superimposed [1H, 15N] HSQC spectra of free Cc (blue) and upon titration with increasing NRP1 concentrations, at differing Cc:NRP1 ratios (1:0.12 [green], 1:0.25 [orange] and 1:0.5 [red]). Gln24 and Lys95 resonances correspond to Cc. Arrows indicate the direction and magnitude of CSPs. (B) Left: Average CSPs (ΔδAvg) experienced by amide NMR signals of Cc in complex with NRP1 (Cc:NRP1 ratio: 1:0.5). Colour bars indicate ΔδAvg categories, as indicated at the right. Right: Mapping of Cc residues perturbed upon binding to NRP1. Cc surfaces are rotated 180° around the vertical axis in each view. Residues are coloured according to their ΔδAvg (ppm).

