Figure 3.
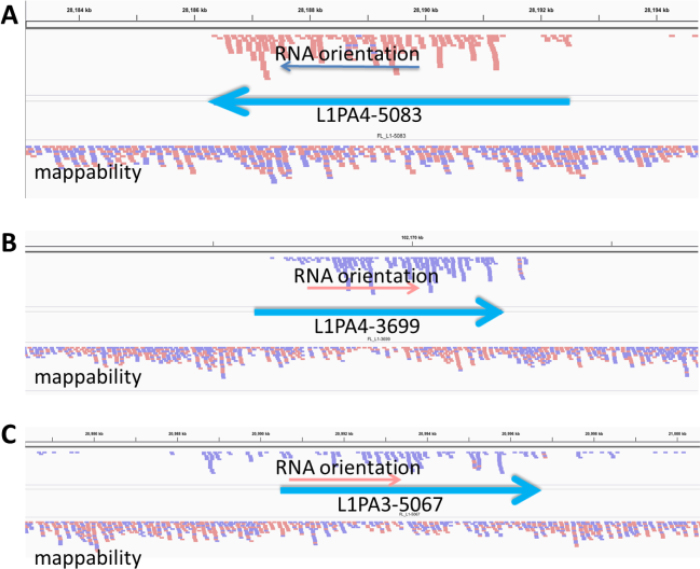
Top alignments to full-length L1 loci from HEK293 cells. Each full-length L1 locus is marked as a heavy blue arrow with the L1 subfamily and locus number from our annotations listed. The lower alignment labeled mappability represent HeLa genomic DNA reads aligned to the genome to show how well individual loci could align to paired end reads. The upper alignment in each panel shows the cytoplasmic polyA reads aligned uniquely to the genome. Reads in the peach color are oriented as sense to the left. Reads in the lavender color are sense to the right. At the bottom of each panel is the gene annotation if any is shown. The introns are marked with large red arrowheads to show gene orientation and the exons are black boxes. Panels A and B show alignments that are consistent with authentic L1 expression. They have no real alignment upstream and appear to originate from the L1 promoter. Panel A has no reads downstream of the L1, while Panel B shows a few reads extending downstream. Panel C is more uncertain as there are more than expected reads upstream and downstream and show some potential for transcripts coming through this location from another promoter.

