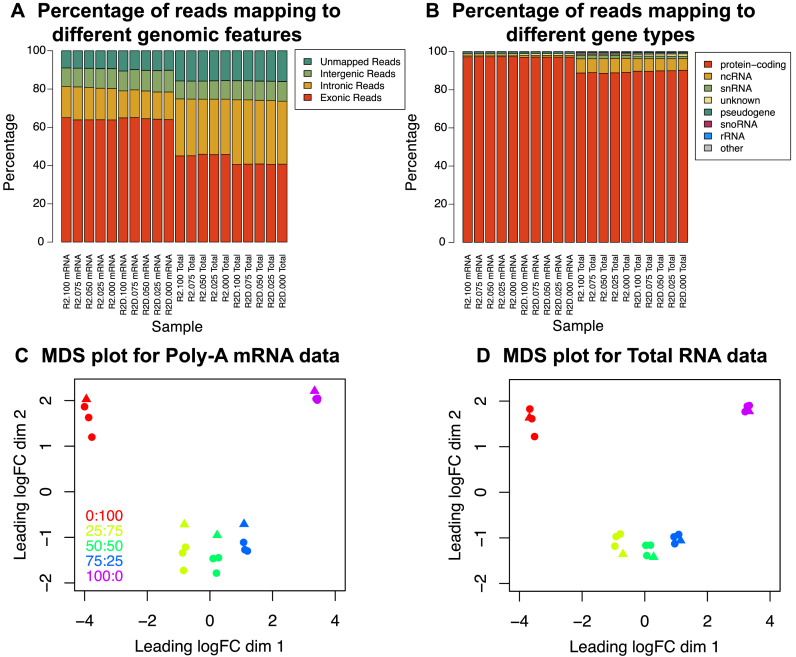
Figure 2.
Overview of data quality of mixture control experiment. (A) Mapping statistics of reads assigned to different genomic features for all replicate two samples (includes both good quality (labels that begin R2) and degraded (labels that begin R2D) RNA samples). The percentages that could be assigned to exons, introns, intergenic regions or were unmapped are shown in different colours. (B) Mapping statistics of reads assigned to different classes of RNA for all replicate two samples. This figure breaks down the gene-level exon reads from panel B according to NCBI's gene type annotation. Multidimensional scaling plot of (C) poly-A RNA and (D) total RNA experiments showing similarities and dissimilarities between libraries. Distances on the plot correspond to the leading fold-change, which is the average (root-mean-square) log2fold-change for the 500 genes most divergent between each pair of samples. Libraries are coloured by mixture proportions, where circles represent good samples and triangles represent degraded samples.

