Figure 4.
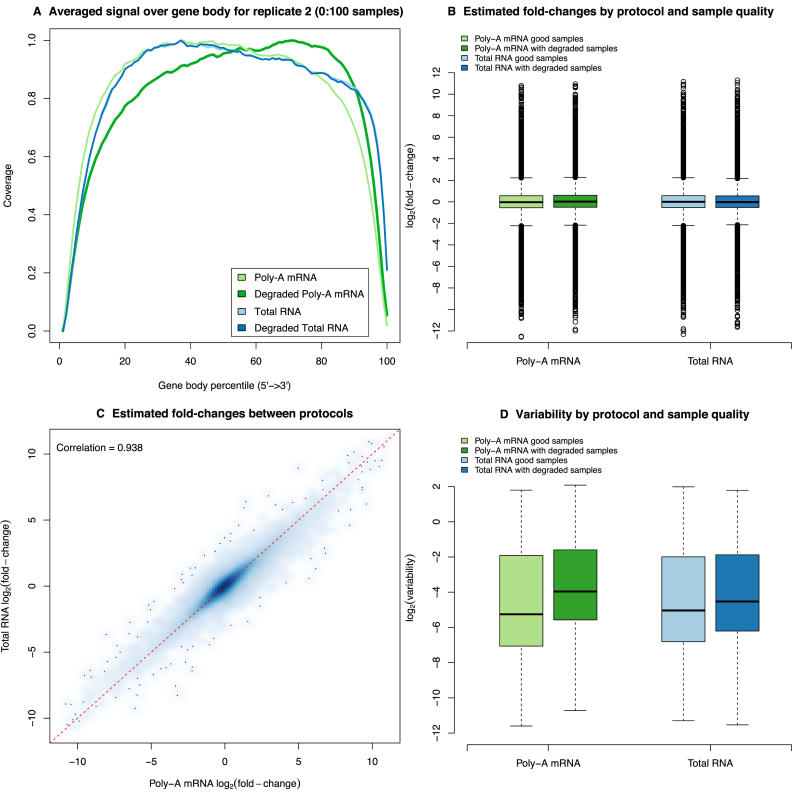
A comparison of library preparation protocols. (A) Plot of read coverage generated by RSeQC for a representative sample from replicate 2. Coverage is fairly uniform for both good quality and degraded total RNA samples and for the good quality poly-A mRNA sample there is a slightly lower coverage at the 3΄ end. For the degraded poly-A mRNA sample, the 5΄ end reads are under-represented in this library. (B) Boxplots for the estimated log-FC (Mg) by protocol and degradation state from the non-linear model fit across all genes. Irrespective of protocol and whether degraded samples are included, we see a good dynamic range, indicating that there are no systematic biases between the different protocols. (C) Smoothed scatter plot of the estimated log-FC (Mg) for the total RNA protocol versus the poly-A mRNA protocol based on the good quality samples. The red dashed line represents the equality line. This plot shows good agreement between library preparation methods with no systematic bias. (D) Boxplots of variability ( ) by protocol and degradation state from the non-linear model fit across all genes. As for the read coverage plot, we see that the poly-A mRNA analysis that includes the degraded samples has systematically elevated levels of variability relative to the other analyses.

