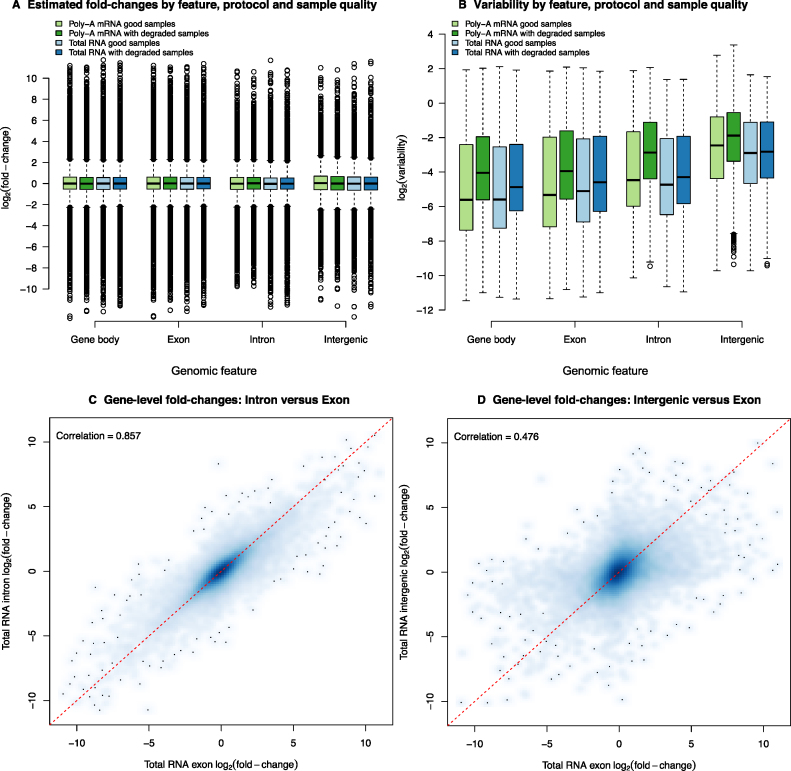
Figure 5.
Exploration of signal and noise across different genomic features. (A) Estimated log-ratios (Mg) by protocol and degradation state obtained from nonlinear model fitted to reads that could be assigned to either the entire gene (i.e. overlapping anywhere from the start to the end), or exons only, or the signal left after subtracting the exon-level counts from the gene total (representing introns and unannotated exons), or intergenic regions. Very similar dynamic ranges of log-FC were observed for data obtained from all classes of features. (B) Variability ( ) by protocol and degradation state obtained from non-linear model fitted across the same feature classes shown in panel A. The level of variability from the model fits were generally comparable between counting strategies, although much higher for intergenic counts, which presumably pick up noise. (C) Smoothed scatter plot of estimated log-FC from the non-linear model fitted to the gene-level intron counts (y-axis) versus the log-FCs estimated from the gene-level exon counts for the total RNA data set, which had more intronic reads. (D) Smoothed scatter plot of estimated log-FCs from counts of neighboring intergenic regions (y-axis) versus the log-FCs estimated from the gene-level exon counts for the total RNA data set. The red dashed lines in panels C and D represent the equality line.

