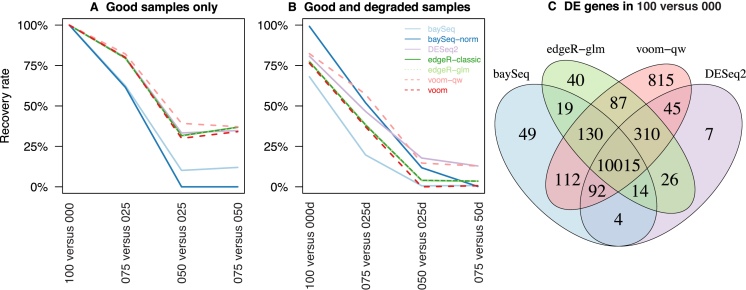
Figure 6.
Recovery rate of differential expression methods. The rate at which DE genes are recovered from 100 versus 000 are displayed for comparisons using (A) good samples only and for those using (B) good and degraded samples. Each method is shown in a distinct colour, with different line-types used when results are overlapping to allow them to be distinguished from one and other. (C) Venn diagram showing the number of common DE genes for 100 versus 000 for selected methods. For a given software package, the method with higher recovery is shown, with exception to baySeq-norm due to its exceedingly high inconsistency rates.

