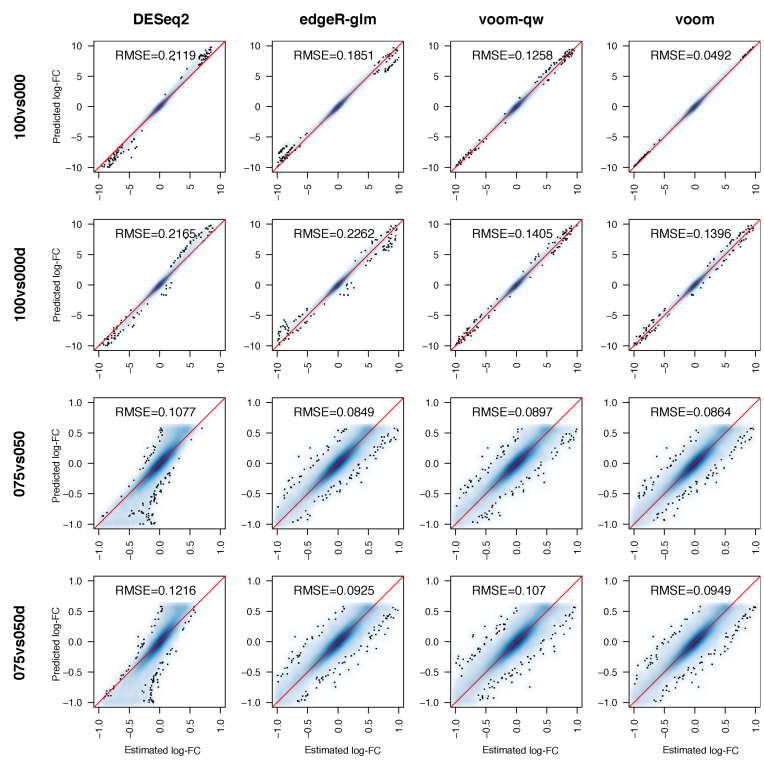
Figure 7.
Accuracy of log-FCs estimated by differential expression methods. Gene-wise log-FCs estimated by the different methods are plotted on the x-axis against predicted log-FCs obtained from the non-linear model on the y-axis. Areas with high density of points are shaded in blue, where colour intensity reflects the density of points. Red lines mark equality between estimated and predicted log-FCs. Root-mean-square error (RMSE, Equation 3) between estimated and predicted log-FCs are displayed in each panel.

