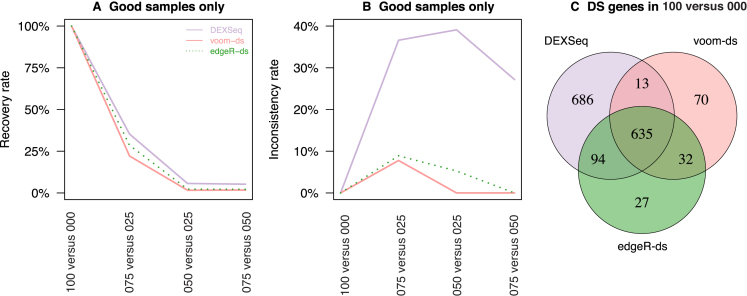
Figure 8.
Recovery and inconsistency rate of differential splicing methods. The rate at which DS genes are recovered from (A) 100 versus 000 and the inconsistency of (B) detected genes are displayed for comparisons using good samples only. Each method is shown in a distinct colour, line-type combination. (C) Venn diagram showing the number of common DS genes for 100 versus 000 across the three methods.

