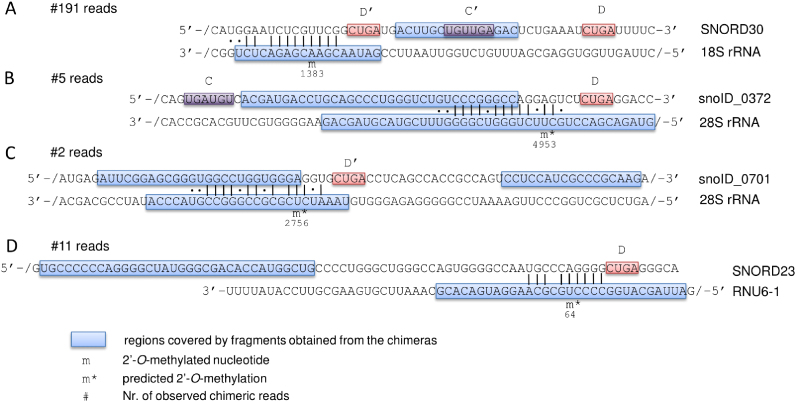
Figure 3.
Schematic representation of snoRNA–target interactions that are predicted based on chimeric reads from CLIP experiments. For each interaction, the snoRNA sequence is shown at the top and the target sequence at the bottom of the panel. ‘/’ indicates that only part of the sequence is shown, for readability. Regions of both snoRNAs and targets that are represented in the chimeric reads are encompassed in blue boxes. Indicated are also the presumed C/C’ and D/D’ boxes as well as the number of chimeric reads supporting each of the interactions. PLEXY-predicted sites of 2΄-O-methylation are marked by ‘m*’ and the previously mapped site is labeled with ‘m’.

