Figure 5.
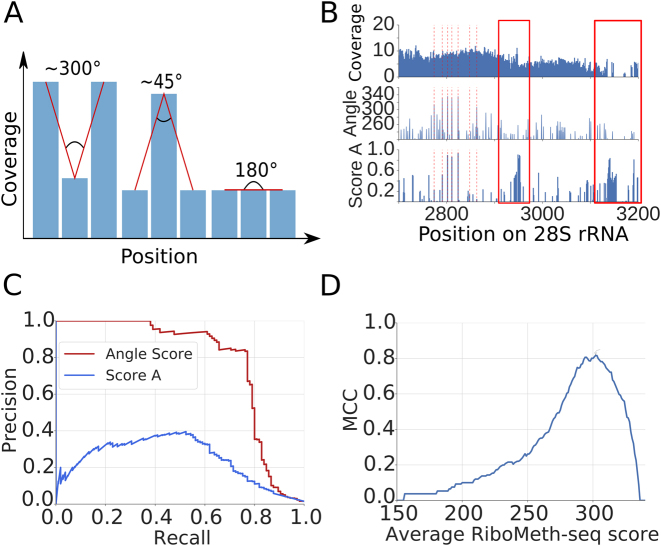
Analysis of RiboMeth-seq data. (A) Strategy for evaluating the RiboMeth-seq data. The score was calculated based on the normalized log2 coverage of a position and of its immediately adjacent neighbors by RiboMeth-seq reads. A large score indicates stronger depletion of the position by 3/5΄ ends of reads and thus resistance to alkaline hydrolysis. (B) Example of a normalized log2 coverage profile along 28S rRNA and calculated scores (Angle and Score A). With red dashed lines positions of known 2΄-O-methylation sites are indicated. The red rectangles indicates regions where no 2΄-O-methylation has been mapped, which is also predicted by the angle score but not by score A. (C) Example of Precision-Recall curves obtained for the two scoring methods applied to rRNAs from the RiboMethSeq_HEK_totalRNA_8min experiment. (D) Matthews correlation coefficient (MCC) plot of average RiboMeth-seq score indicating the optimal angle score.

