Figure 1.
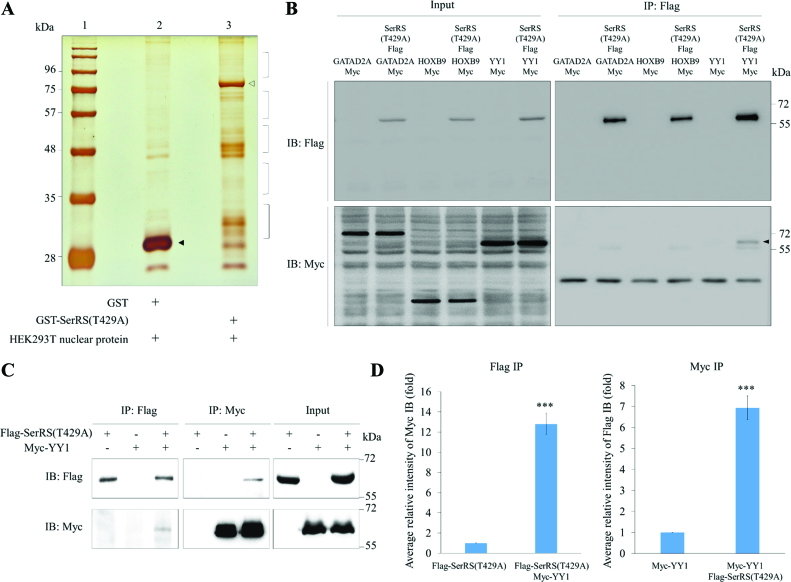
Screening and identification the putative proteins interacting with SerRS. (A) The GST pull-down assay. Nuclear proteins extracted from HEK293T were pulled down with the recombinant GST-SerRS(T429A). Lane 1, protein markers; lane 2, protein profiles of GST pull-down; lane 3, protein profiles of GST-SerRS(T429A) pull-down. Protein bands marked with brackets on lane 3 were excised for LC–MS/MS. GST and GST-SerRS(T429A) were marked with ▴ and △, respectively. (B) Screening of three putative proteins interacting with SerRS(T429A) by Co-IP. HEK293T cells were co-transfected with a plasmid expressing Flag-tagged SerRS(T429A) and a plasmid expressing Myc-tagged GATAD2A, HOXB9 or YY1. Cell lysate was immunoprecipitated with anti-Flag (IP: Flag), followed by Western blot (IB) using either anti-Flag to detect Flag-SerRS(T429A) (IB: Flag) or anti-Myc to detect Myc-GATAD2A, Myc-HOXB9 and Myc-YY1 (IB: Myc). A positive band was detected only when co-transfecting Flag-SerRS(T429A) and Myc-YY1 (marked with ▴). Input represents 10% of the total cell extract used for each immunoprecipitation. (C) Co-IP demonstrated the direct interaction between SerRS(T429A) and YY1. HEK293T cells were co-transfected with Myc-YY1 and SerRS(T429A). Afterwards, cell lysate was immunoprecipitated with either anti-Flag (IP: Flag) or anti-Myc (IP: Myc), followed by Western blot using anti-Flag to detect Flag-SerRS(T429A) (IB:Flag) and anti-Myc to detect Myc-YY1 (IB:Myc). Myc-YY1 fusion protein was immunoprecipitated with Flag-SerRS(T429A). Input represents 10% of the total cell extract used for each immunoprecipitation. (D) Quantification of the intensities of Flag and Myc, as shown on Co-IP, when the IP intensities of Flag-SerRS(T429A) and Myc-YY1 were individually normalized as 1. Data are calculated from three independent experiments and presented as mean ± SD (n = 3). Student's t-test was used to determine significant differences between each group (*P < 0.05, **P < 0.01 and ***P < 0.005).

