Figure 2.
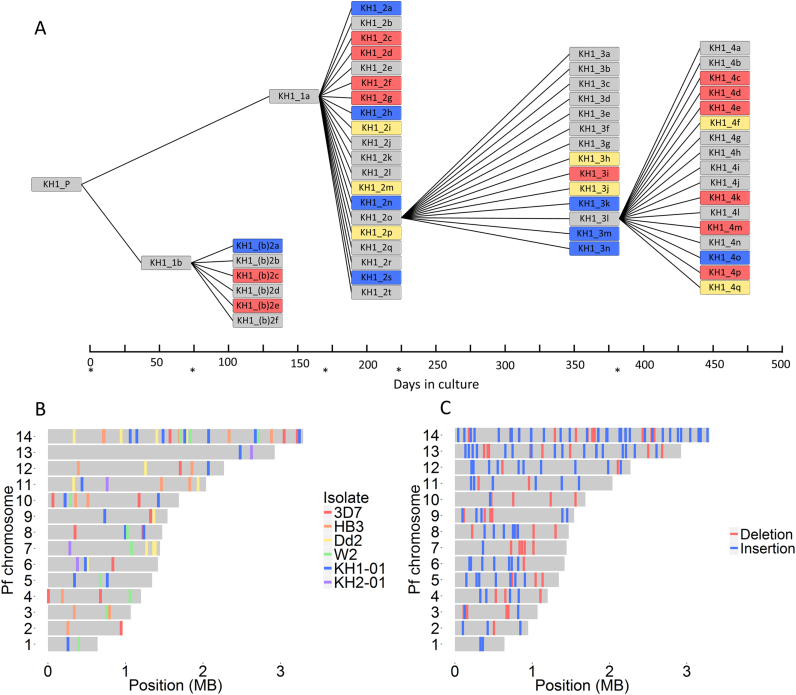
Detecting de novo mutations in mitotic ‘clone trees’. (A) Schematic of the KH1-01 clone tree. Each branch point represents a round of subcloning by limiting dilution, isolating single infected red blood cells, and asexually expanding them until we obtained sufficient amounts of DNA for whole-genome sequencing. The KH1-01 clone tree was cultured for ∼17 months and contained 59 subclone genomes derived from the parent isolate (obtained soon after venous sampling from a patient in Cambodia). Blue = de novo BPS detected; red = pairs of recombining var genes detected; yellow = both BPS and var gene recombination detected; asterisks = clonal dilutions performed. (B) Overall, in the clone trees of six wild-type P. falciparum isolates (3D7, HB3, Dd2, W2, KH1-01 and KH2-01), we identified 85 de novo BPS, 78 of which have known genomic coordinates (shown here). The 78 BPS with known genomic coordinates were distributed across the 14 nuclear chromosomes as expected by chance (P = 0.445, Fisher's exact test). Colors depict the isolate in which the BPS occurred. (C) We identified 164 de novo indels in the 3D7 clone tree, all of which have known genomic coordinates (shown here). Like BPS, indel distribution between the 14 chromosomes did not differ significantly from what is expected by chance (P = 0.194, Pearson's Chi-squared test). Insertions (n = 108) and deletions (n = 56) are colored blue and red, respectively.

