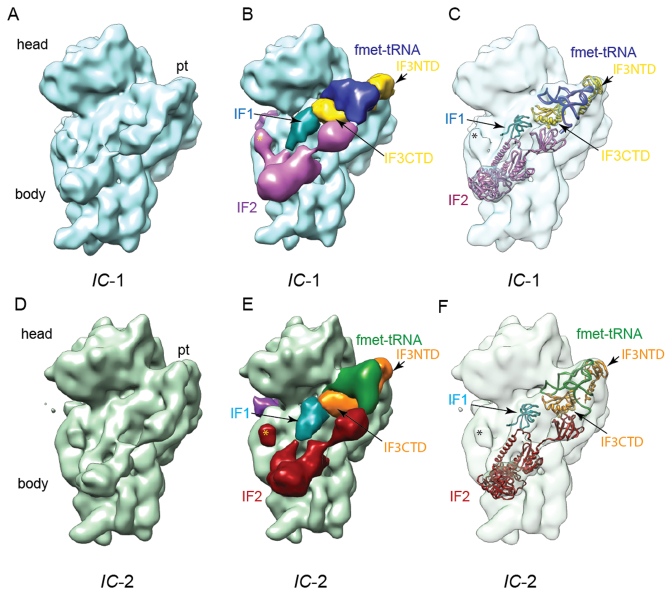
Figure 1.
Overview of the two distinct 30S preIC states observed in the presence of GE81112 by cryo-EM. The (A–C) 30S IC-1 and (D–F) 30S IC-2 maps are shown as viewed from the 50S ribosomal subunit interface. (A and D) The volumes are rendered as a solid surface with the 30S landmarks, head, body and platform (pt) indicated. (B and E) The volumes have been segmented using Segger (24) and the segmented densities are uniquely colored and labeled to reflect their correspondence with the 30S ligands: fMet–tRNA, IF1, IF2, IF3CTD and IF3NTD. (C and F) The volumes are rendered as a transparent surface and the models corresponding to the 30S ligands (fMet–tRNA, IF1, IF2, IF3CTD and IF3NTD) are shown as ribbons (see Materials and Methods). In panels B–C and E–F the star indicates density that we attribute to the G1 domain of IF2 while the dark purple density located on the back of the subunit near the mRNA entrance channel is attributed to the N1/N2 domain of IF2.

