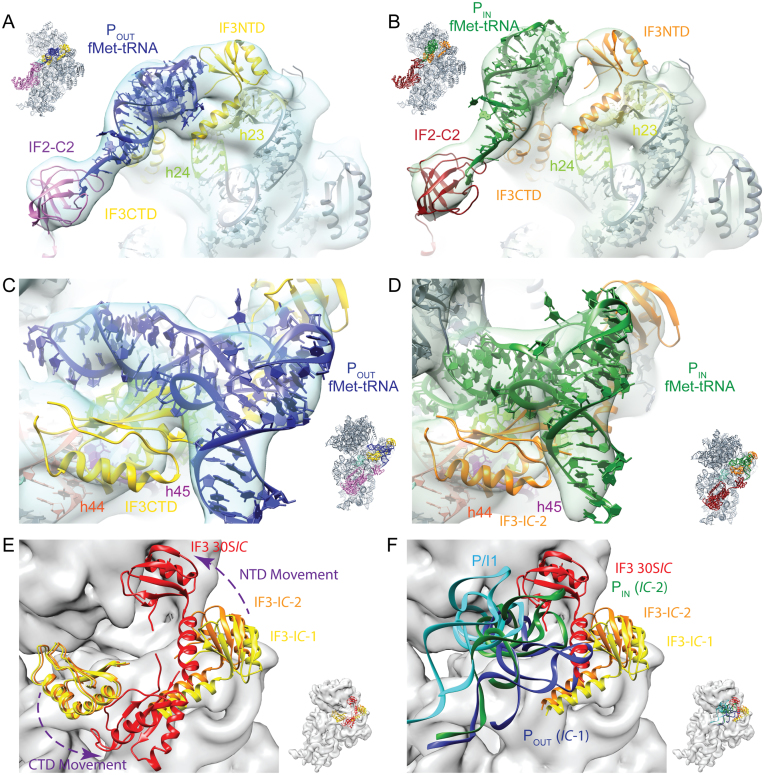
Figure 3.
fMet–tRNA in 30S IC-1 and 30S IC-2 structures is bounded by IF3NTD and IF3CTD. The IF3NTD (A and B) and IF3CTD (C and D)were placed by rigid body docking in to 30S IC-1 (blue transparent surface) and 30S IC-2 (green transparent surface). In panels A–B, 16S rRNA helices 23 (h23, residues 684–705) and 24 (h24, residues 783–800) that form an interface with IF3NTD are colored pale yellow and pale green, respectively. In panels C–D, 16S rRNA helices 24 (h24, residues 783–800), 44 (h44, residues 1401–1408 and 1494–1501) and 45 (h45, residues 1506–1529) that form an interface with IF3CTD are colored pale green, red-orange, and purple, respectively. The orientation of the model in each panel is indicated by the inset. (E and F) The IC-1, IC-2 and 30SIC (11) models have been aligned on the 30S subunit body to highlight the different conformations of IF3 (E) and illustrate that IF3NTD follows the elbow region of the tRNA as it moves from the POUT (blue), to PIN (green), to the P/I1 (cyan; (11)) site (F). In panel F it is notable that the P/I1 site seen by Julián et al. is distinct from both the PIN, POUT sites seen here and this difference may result from the IF3 movement seen in panel E. IF3 as seen in the IC-1 and IC-2 states is colored yellow and orange, respectively, while IF3 as observed in the 30SIC by Julián et al. is colored red. Panels E and F are from the same perspective but in E the fMet–tRNAs are not shown for clarity, while in F the IF3CTD is omitted and the tRNAs are illustrated as colored ribbons. The model corresponding to the 30S ribosomal subunit has been rendered as a gray surface. The purple arrows indicate the relative movement of the IF3CTD and IF3NTD. PDB files corresponding to the 30SIC (EMD-1771) were kindly provided by Mikel Valle.

