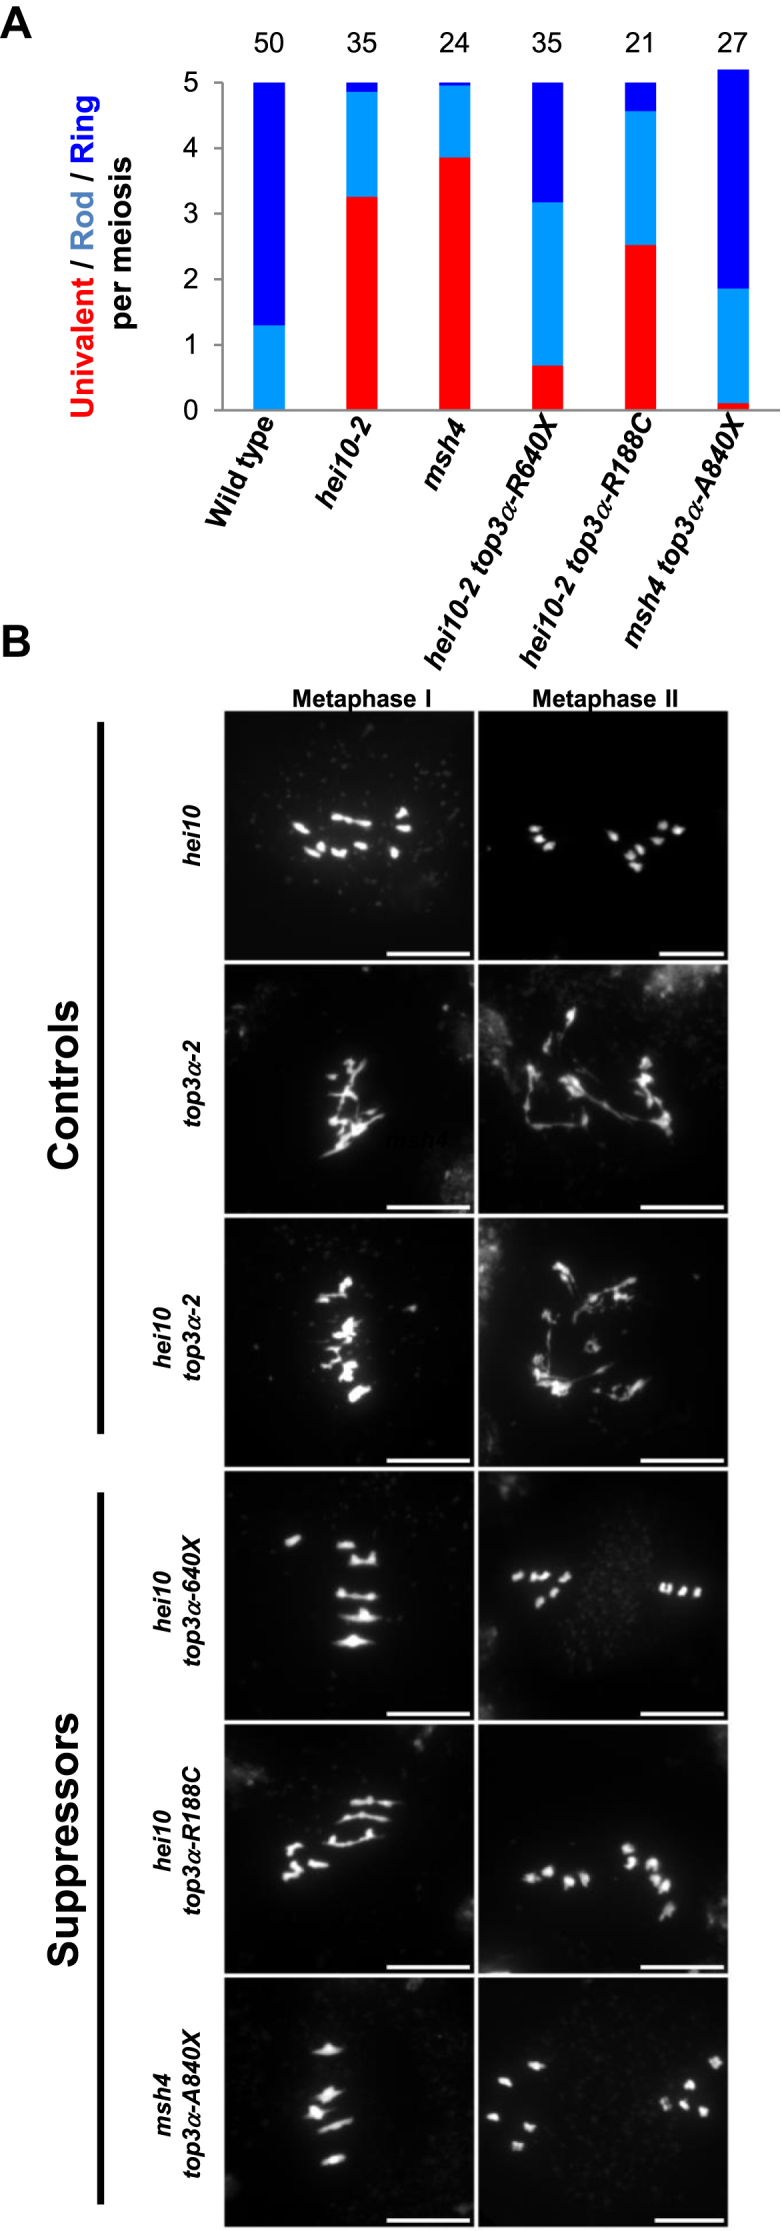
Figure 6.

Separation of function mutations in TOP3α restore bivalent formation in zmm mutants. (A) Average number of bivalents per male meiocyte. Light blue bars represent rod bivalents, which have a rod shape with enlarged ends, indicating that one arm has at least one CO, whereas the other arm has no CO. Dark blue bars indicate ring bivalents, which have a lozenge shape, indicating that they have at least one CO on both arms. Red bars indicate pairs of univalents. The number of cells analyzed is indicated above each bar. (B) Chromosome spreads at metaphase I and metaphase II. (Scale bars, 10 μM). For top3α-2 and hei10 top3α-2, images of anaphase I are displayed as meiosis does not proceed further in these genotypes.
