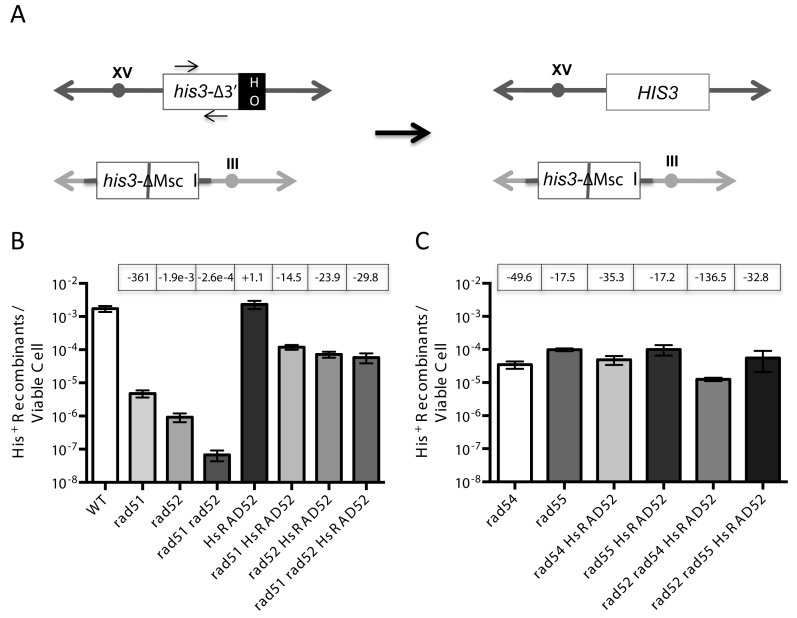
Figure 3.
HsRAD52 suppresses the double-strand break (DSB)-stimulated ectopic gene conversion (EGC) defect in rad51 and rad52 mutant cells (A) Scheme depicting the his3 EGC assay. The his3-Δ3΄-HOcs substrate (white ‘his3Δ-3΄ box) at the HIS3 locus on chromosome XV (dark gray double ended arrow) substitutes a 127 bp DNA fragment containing an HO cut site (black ‘HO’ box) for 238 bp of the 3΄ end of the HIS3 coding sequence and flanking DNA. The his3-ΔMsc I substrate (white ‘his3-ΔMsc I’ box) at the LEU2 locus on chromosome III (light gray double ended arrow) is comprised of a 1.8 kb genomic clone containing the HIS3 gene that has been disrupted by the insertion of a 10 bp Not I linker into the Msc I site in the coding sequence (gray bar). These substrates share 413 bp of uninterrupted homology between the Msc I site and 5΄ end of the HOcs, and 443 bp between the 3΄ end of the HOcs and downstream Bam HI site. Repair of an HO-catalyzed DSB at the his3-Δ3΄-HOcs substrate by unidirectional transfer of information from the his3-ΔMsc I substrate (black arrow) creates an intact HIS3 gene. The positions of the primers used to detect the association of proteins with the HIS3 locus in chromatin immmunoprecipitation (ChIP) experiments are depicted as arrows above and below the white ‘his3Δ-3΄’ box. (B) The effect of HsRAD52 on frequencies of EGC in wild-type, and rad51, rad52 and rad51 rad52 mutant strainsSingle colonies of wild-type and mutant his3 DSB-stimulated ectopic gene conversion haploid strains grown on YPD plates were used to inoculate at least 10 one milliliter YPGL cultures per genotype, and grown overnight. After a period of induction of HO endonuclease appropriate dilutions of cells were plated onto YPD to assess viability, and medium lacking histidine to select for recombinants. EGC frequencies were determined by dividing the number of His+ recombinants by the number of viable cells plated. The mean recombination frequency from a minimum of 10 independent determinations for each genotype and 95% confidence intervals was plotted. Fold differences above (+) and below (-) the wild-type frequency are indicated in boxes above the graphed value for each genotype. Strains used in this analysis: WT – ABX3666-37B; rad51Δ - ABX3678-49B; rad52Δ - ABX3697-82D; rad51Δ rad52Δ - ABX3728-14A; HsRAD52 – ABX3703-36B; rad51Δ HsRAD52 – ABX3728-28A; rad52Δ HsRAD52 – ABM537; rad51Δ rad52Δ HsRAD52 – ABX3728-11C. (C) The effect of HsRAD52 on frequencies of EGC in rad54, rad55, rad52 rad54 and rad52 rad55 mutant strains Same as legend for panel B. Strains used in this analysis: rad54Δ - ABM562; rad55Δ - ABM571; rad54Δ HsRAD52 – ABM564; rad55Δ HsRAD52 – ABM568; rad52Δ rad54Δ HsRAD52 – ABM563; rad52Δ rad55Δ HsRAD52 – ABM570.

