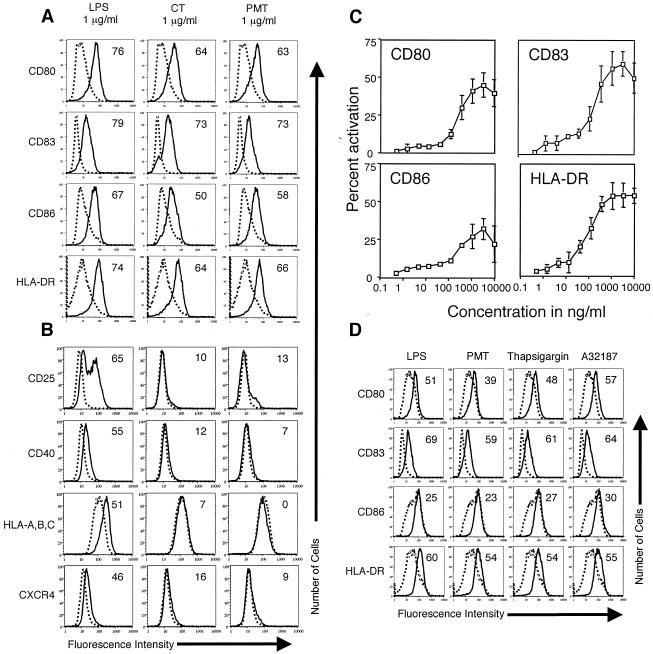
FIG. 1.
PMT activates human MDDC to mature. Cell surface expression of the indicated markers on untreated MDDC (dotted histograms) or MDDC treated with the indicated agonist (solid histograms). A. Day 4 MDDC were incubated with 1 μg of LPS, CT, or PMT/ml for 20 h. The cells were harvested and stained for four-color flow cytometry with phycoerythrin (PE)-anti-CD80, fluorescein isothiocyanate (FITC)-anti-CD83, Cy-Chrome-anti-CD86, or the fluorochrome APC-anti-HLA-DR. Data are representative of one experiment of six performed on cells from different donors with similar results. B. Day 4 MDDC were incubated with 1 μg of LPS, CT, or PMT/ml for 20 h. The cells were harvested and stained for three-color flow cytometry with PE-anti-CD25, PE-anti-CD40, FITC-anti-HLA-A, -B, or -C, or the fluorochrome APC-anti-CXCR4. Data are representative of one experiment of three performed on cells from different donors with similar results. C. Day 4 MDDC were incubated with half-log dilutions (10 μg to 500 pg/ml) of PMT for 20 h. The cells were harvested and stained for four-color flow cytometry with PE-anti-CD80, FITC-anti-CD83, Cy-Chrome-anti-CD86, or the fluorochrome APC-anti-HLA-DR. The percentage of cells that increased the expression of a marker (percent activation) was calculated as described in Materials and Methods. The data shown are the averages and standard deviations of three experiments performed on cells from different donors. D. Day 4 MDDC were incubated for 20 h with 1 μg of LPS or PMT/ml, 10 μM thapsigargin, or 150 ng of A23187/ml. The cells were harvested and stained for four-color flow cytometry with PE-anti-CD80, FITC-anti-CD83, Cy-Chrome-anti-CD86, or the fluorochrome APC-anti-HLA-DR. Data are representative of one experiment of five performed on cells from different donors with similar results.

