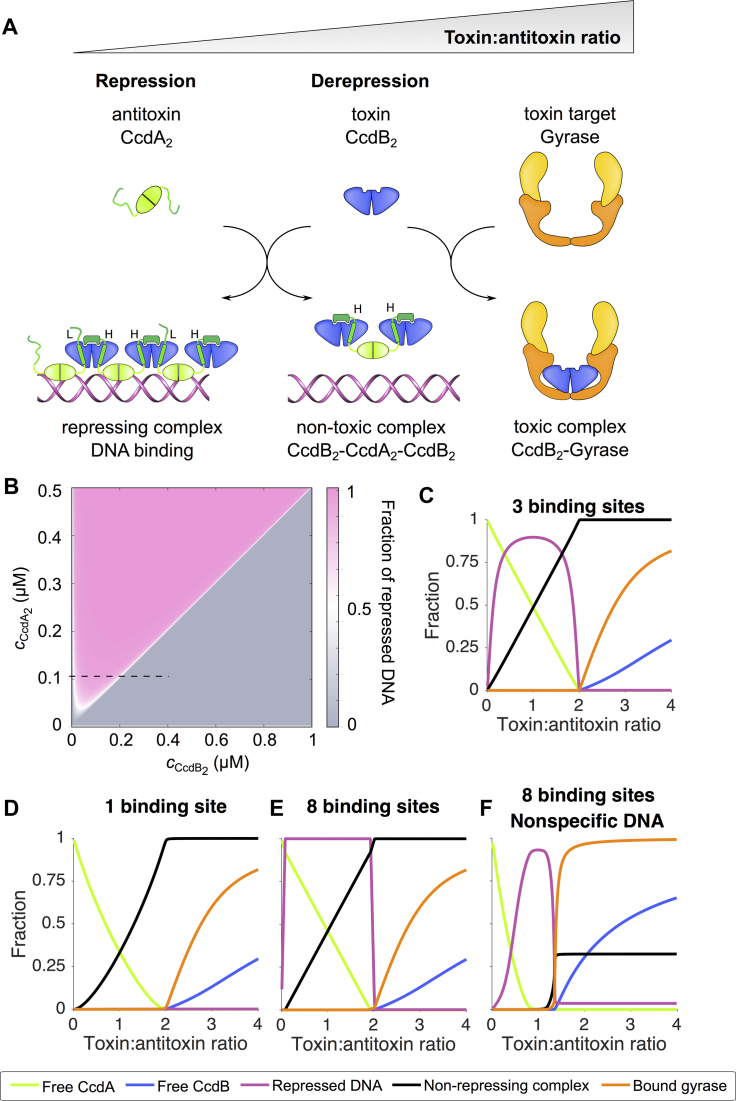
Figure 7.
Multiple coupled low-affinity binding sites on the operator ensure a tight ratio-dependent transcriptional regulation of the ccdAB operon. (A) Schematic overview of the regulation of the ccdAB operon. The toxin:antitoxin ratio increases from left to right. (B) Heat plot showing the fraction of repressed operator DNA as a function of the dimer concentrations of CcdA2 and CcdB2. (C) Horizontal cross-section of the phase diagram as indicated by the dotted line on the heat plot. The curves represent the fraction of free CcdA2 relative to the total amount of CcdA2 (green), the fraction of free CcdB2 relative to the total amount of CcdB2 (blue), the fraction of bound DNA relative to the total amount of DNA (magenta), the fraction of non-repressing complex CcdB2-CcdA2-CcdB2 relative to the total amount of CcdA2 (black) and the fraction of bound gyrase relative to the total amount of gyrase (orange). (D–F) Simulations of the regulation of the ccdAB operon demonstrate the effect of multiple binding sites and the effects of non-specific DNA. Panels C–E show simulations performed with the simple model in the absence of non-specific DNA, panel F shows the simulation with the extended model in the presence of non-specific DNA. Model descriptions are given in Materials and Methods. All calculations are performed at 25°C.

