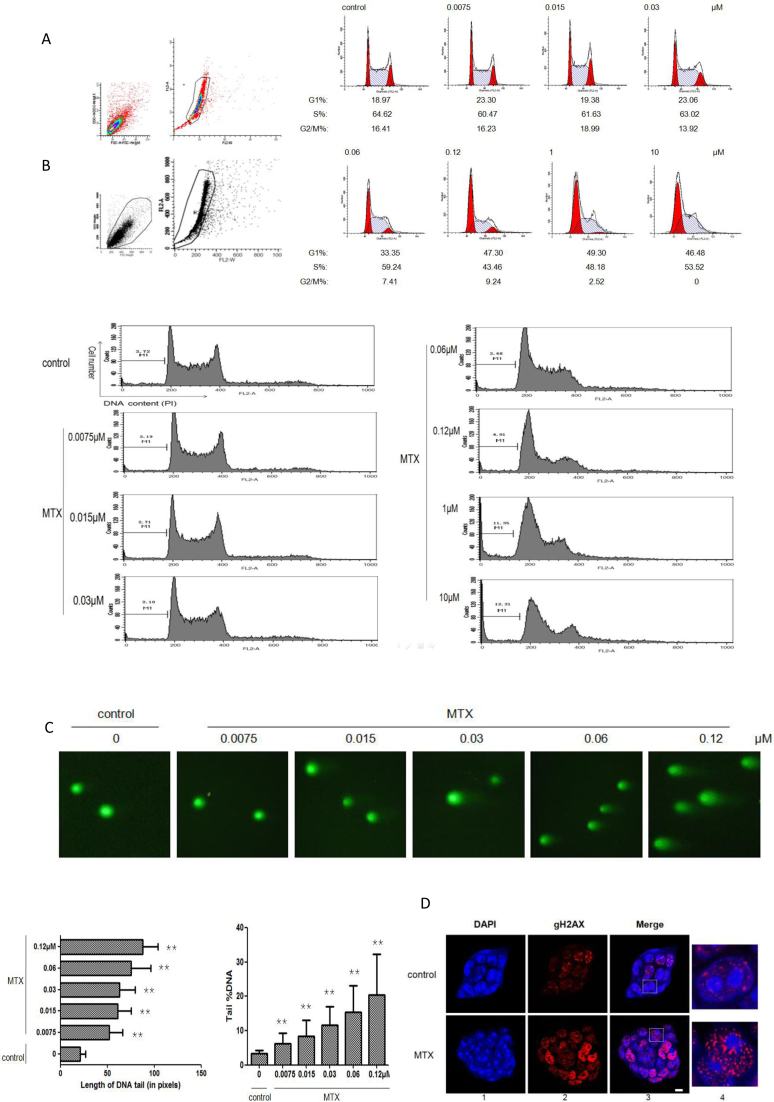
Figure 1.
Establishing MTX concentrations that induce DNA breaks and the effect of MTX on DNA. (A) Analysis of the cell cycle in mESCs with different doses of MTX after 24 h of treatment, by flow cytometry. The results were graded according to the cell cycle phase. (B) Rate of apoptosis in mESCs at different doses of MTX after 24 h of treatment, by flow cytometry. (C) Comet assays in mESCs at different doses of MTX after 24 h of treatment. The length of the DNA tail and tail %DNA for each dose of MTX are shown. Values are means ± SD (standard deviation) derived from three independent experiments. ** Indicates a statistically significant difference compared with the control (P < 0.01) based on Student's two-tailed t-test. (D) Representative images of nuclei with gH2AX foci in mESCs following 0.12 μM MTX for 24 h, by immunofluorescent staining gH2AX (panel 2). Nuclear DNA was stained by DAPI (panel 1). Merged images (panel 3) are shown. One representative nucleus with associated merged images (panel 4) are shown. Red: gH2AX; blue: DAPI staining. Bar, 5 μM.

