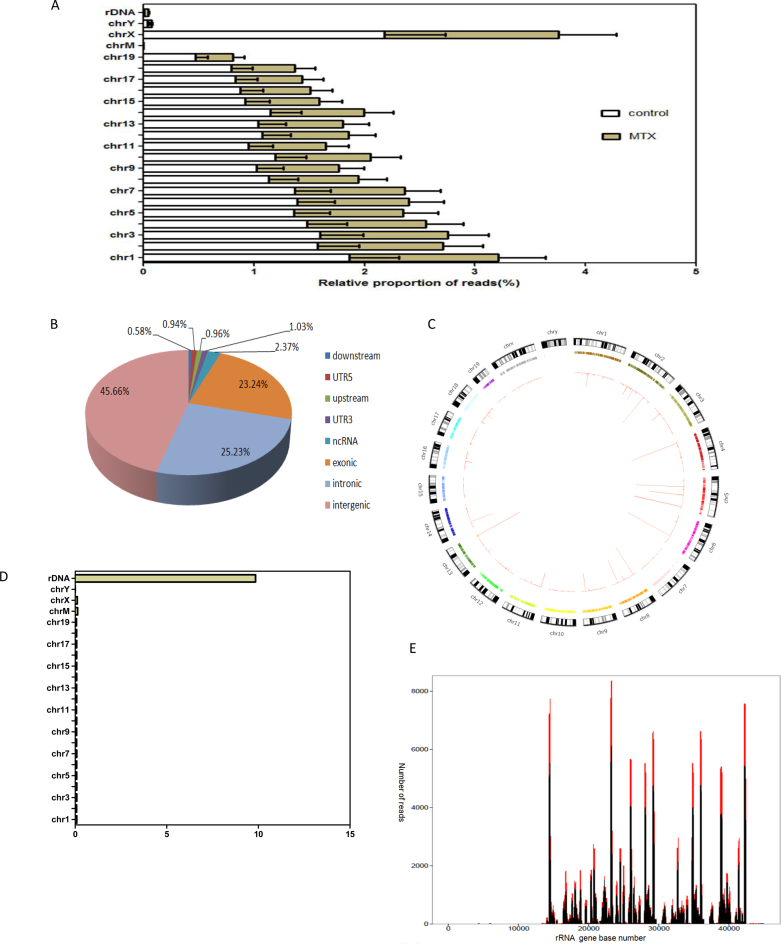
Figure 3.
Genome-wide hot spots of DSBs in rRNA genes units in MTX-treated mESCs (A) The relative proportion of reads of DSBs in chromosomes of mESCs from the MTX and control obtained by Illumina sequencing. (B) Genome-wide distribution of DSB sites induced by MTX. (C) Genome-wide MTX sensitivity landscape of DSBs in each chromosome in mESCs by hypergeometric test and visualized using Circos. (D) Significantly enriched DSBs in rRNA genes in mESCs compared to the rest of the genome calculated the fold-change in the number of reads. (E) Distribution of DSBs peak in the IGS regions of rRNA genes in mESCs detected with F-seq in complete medium and in complete medium with 0.12 μM MTX for 24 h. The control is in black and the treated is in red. X-axis represents the rRNA gene base number, Y-axis represents the read counts.

