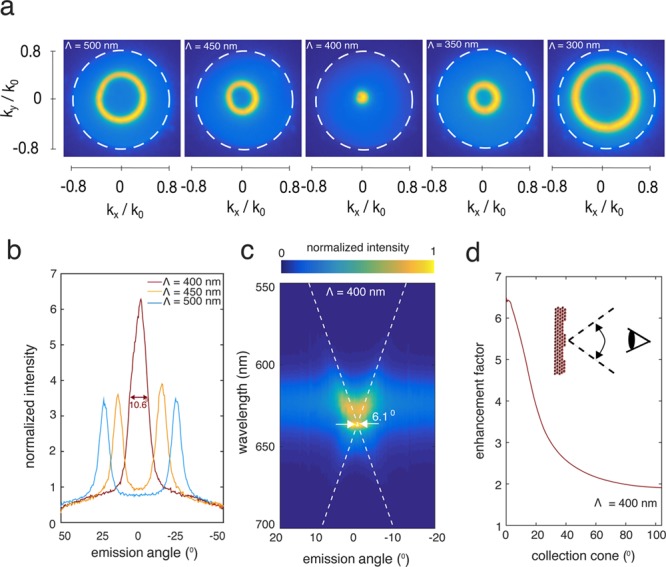
Figure 2.

(a) Normalized k-space color maps of fluorescent emission from the right-most five bull’s-eye gratings of Figure 1c (Λ = 500–300 nm). Dashed white lines indicate the numerical aperture of the objective (N.A. = 0.8). (b) Vertical line traces at kx/k0 = 0 through the k-space color maps of the left most three panels of panel a (Λ = 500, 450, and 400 nm). Traces are normalized to the maximum nonresonant intensity. (c) Normalized spectral-angular color map of the Λ = 400 nm bull’s eye grating. Dashed white lines are fits to eq 1 (see text for details). (d) Enhancement of fluorescence out-coupling from the Λ = 400 nm bull’s eye grating as compared to the nonresonant case, as a function of the collection cone (see inset for schematic).
