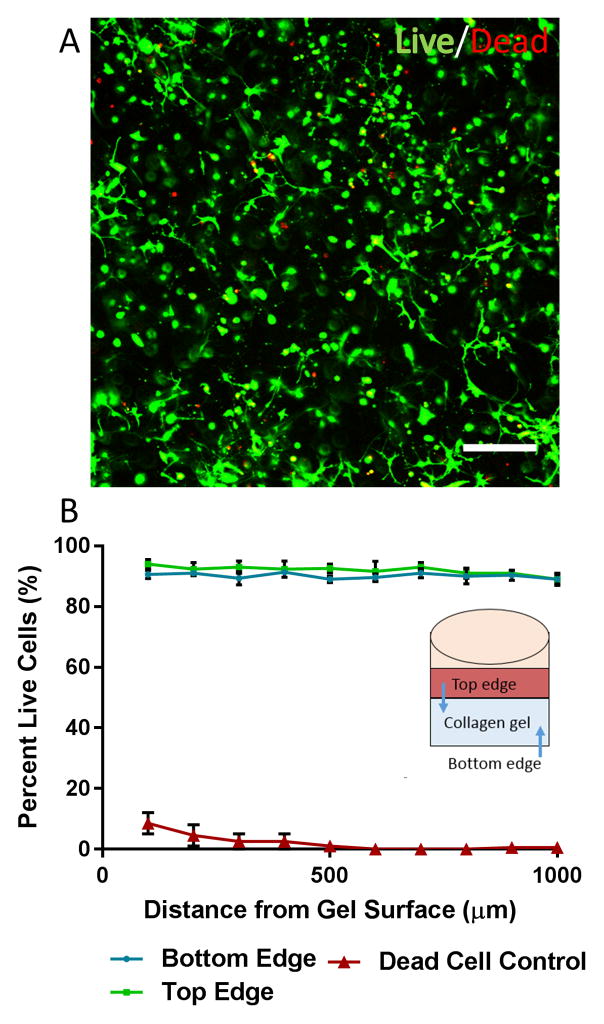
Figure 3. primary neural cell viability in collagen gel after 1 week in culture.
the percentage of live cells was determined using calcein-am/ethidium homodimer-1 cell staining. (a)representative live/dead immunofluorescent image obtained via confocal microscopy. the image was taken at a 300 μm depth in the gel. green=live. red=dead. scale bar 200 μm. (b) calculated cell viability as a function of depth from the gel surface from both the top and bottom edge of the gel (with respect to the media layer). a dead cell control (30 min exposure to methanol) was also included to confirm proper operation of the assay.

