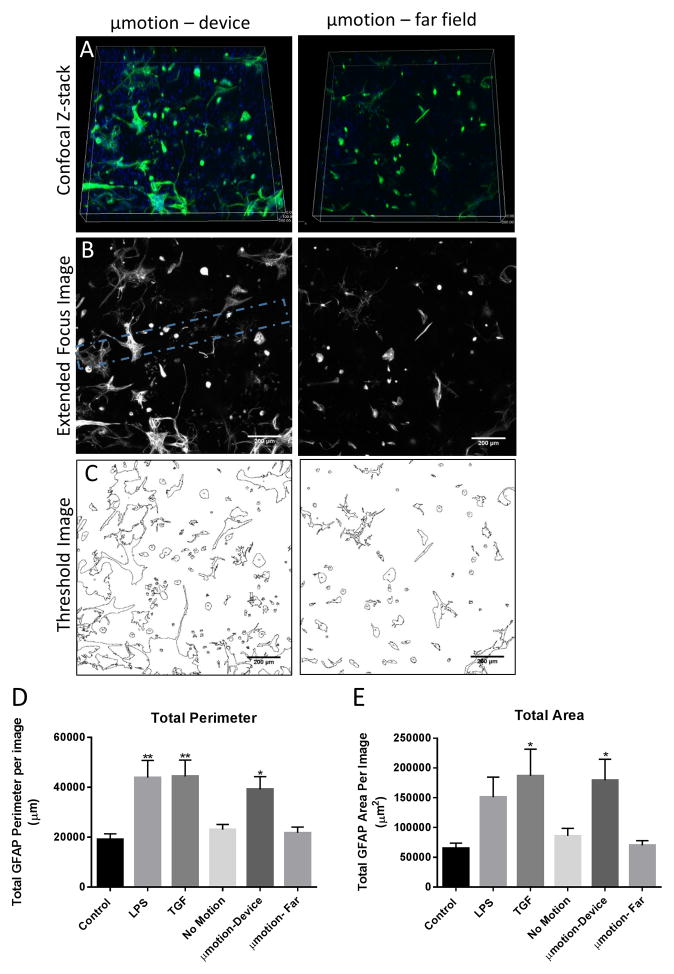
Figure 4. characteristic images obtained following glial scar experiment and quantified astrocyte morphology.
(a) example 3d rendering of a confocal z-stack of the gfap staining after 1 week of micromotion in a region directly surrounding the implant (left) and a region > 5mm from the device location (right) within the same well. (b) example extended focus confocal images of the gfap staining after 1 week of micromotion in a region scale bar 200 μm. the device location is indicated with a dotted line in the micromotion image. (c) astrocytes were identified after thresholding the image with imagej. these shapes of these images was analyzed using the particle analysis tool to assess differences in cellular morphology (cell perimeter and area). astrocytes were found to exhibit characteristics of glial scar formation after 1 week in culture for positive control wells and micromotion wells. scale bar 200 μm. (d) the total gfap perimeter per image and (e) total gfap area per image as determined by imagej analysis for static control, positive control (tgf-b and lps), device wells (no motion and micromotion), and far field controls. *p<.05, **p<.01 compared to the control. all sample sizes are n=9, besides for no motion which is n=7.

