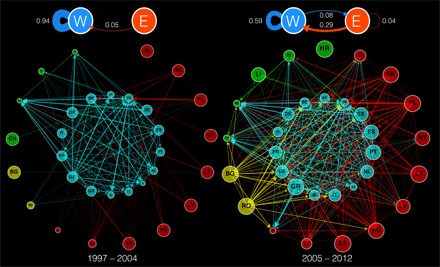
Fig. 4. High-skilled net mobility networks (Δij), before and after the 2004 EU enlargement.

(Top) Mobility between the 2004/2007 entrant countries (“E”) and the rest of the incumbent European countries (“W”). The networks in each period are calculated from a total of 43,075 head counts (1997–2004) and 272,813 head counts (2005–2012), respectively. Link thickness represents the fraction of the total mobility. (Bottom) Node color represents EU entry year group (gEU,i); node size is proportional to the mobility polarization, 1 + Bi (with larger values indicating larger mobility out of country i); link thickness is proportional to log(|Δij|)2 between countries i and j, with the arrow pointing in the direction of the net flow and link color corresponding to the source node. The size/thickness scales used for both networks are the same, facilitating direct comparison.
