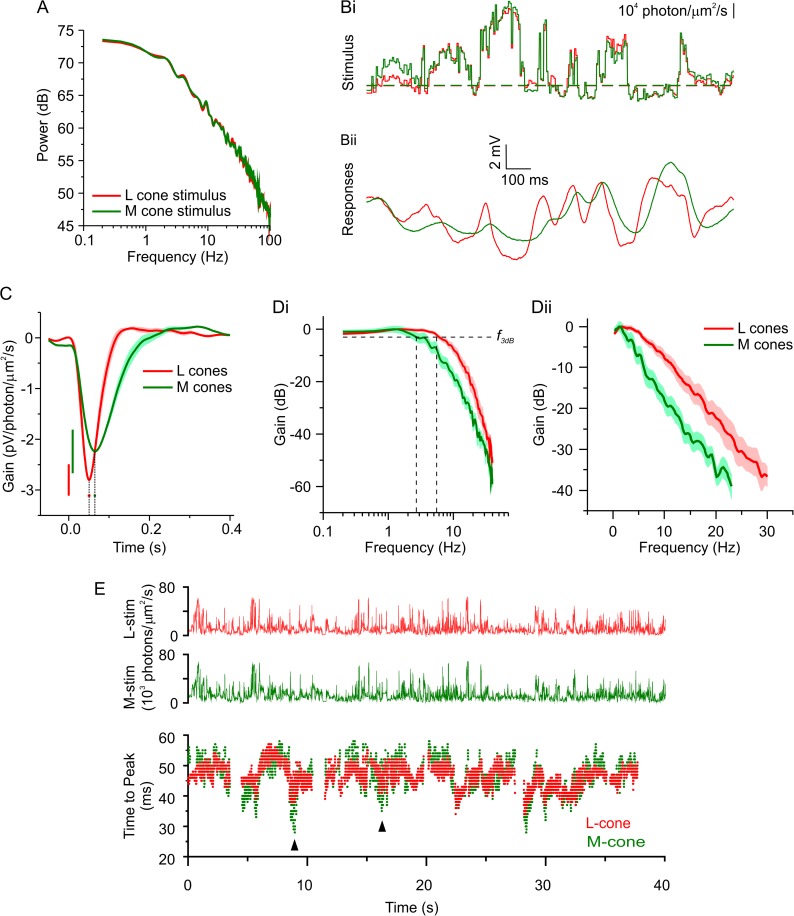
Fig 1. L- and M-cones adapt to contrast—natural time series of chromatic intensity (NTSCI).
(A) Power spectral density of the long- (red) and mid- (green) wavelength sensitive cone photoreceptors (L- and M-cones) -specific NTSCI stimuli. (Bi) A small section of the two cone-specific versions of the NTSCI and the corresponding response (Bii) of a representative L- (red) and M- (green) cone. (C, D) The mean ± standard error of the mean (SEM) impulse-response functions (C) and normalized frequency response amplitude (D) of four L- and four M-cones under the NTSCI condition. C and D are both representations of the characteristics of the stimulus-response transfer function to the entire NTSCI (i.e., the full 40 s). In C, the SEMs of the peak amplitudes are indicated by the color-coded vertical bars, and the SEMs for the time that the maximal peak value occurs (time to peak, T2P) are indicated by the color-coded horizontal bars. Dii shows the data on a linear frequency axis to highlight the differences at higher frequencies, and Di shows the method for determining the frequency at which the frequency response amplitude had dropped by −3dB (f3dB). (E) Upper, the L- and M-cone-specific NTSCI stimuli. Lower, the T2P of impulse-response functions calculated over 1-s periods at random locations during the NTSCI for a representative L- and M-cone. Arrowheads indicate two areas where the M-cone T2P occurred sooner than for the L-cone. The data to generate this figure can be found in S1 Data.

