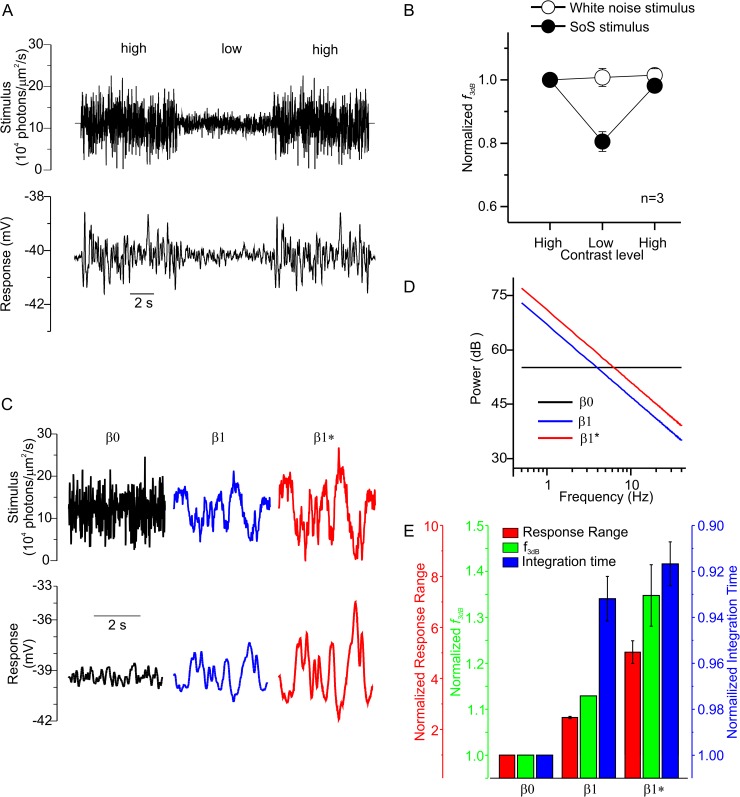
Fig 4. Adaptation depends on the frequency distribution of the stimulus.
(A) A white noise (WN) stimulus that switches from high to low contrast and back again (upper) and a resulting long- wavelength sensitive cone photoreceptor (L-cone) response (lower). (B) The mean ± standard error of the mean (SEM) normalized f3dB for three cones that experienced both the WN and the sum-of-sinusoids (SoS) (Fig 3Ci) contrast-switching stimuli. While f3dB decreased when the SoS stimulus shifted from high contrast to low and increased when contrast switched back to high, f3dB was unaffected when the WN stimulus switched between contrast levels. Panel C shows the β0 (black), β1 (blue), and β1* (red) stimuli in the upper panel, and an L-cone’s response to these stimuli is shown in the lower panel. The spectral power density of β0 was equal across all frequencies used, whereas it declined in a 1/f1 manner for β1 (D). β1* was a higher-contrast version of β1, generated by simply increasing the power of each frequency used by an equal amount. (E) The mean ± SEM response range (red), f3dB (green), and integration time (blue) while under the β0, β1, or β1* stimuli. In each case, the data are normalized to the value obtained during the β0 condition. Seven mid- and long-wavelength sensitive cone photoreceptors (M- and L- cones) experienced both the β0 and the β1 stimuli, and five experienced both the β0 and the β1* stimuli. Note that the axes have been scaled so that the means for each response variable can be seen. The data to generate this figure can be found in S1 Data.

