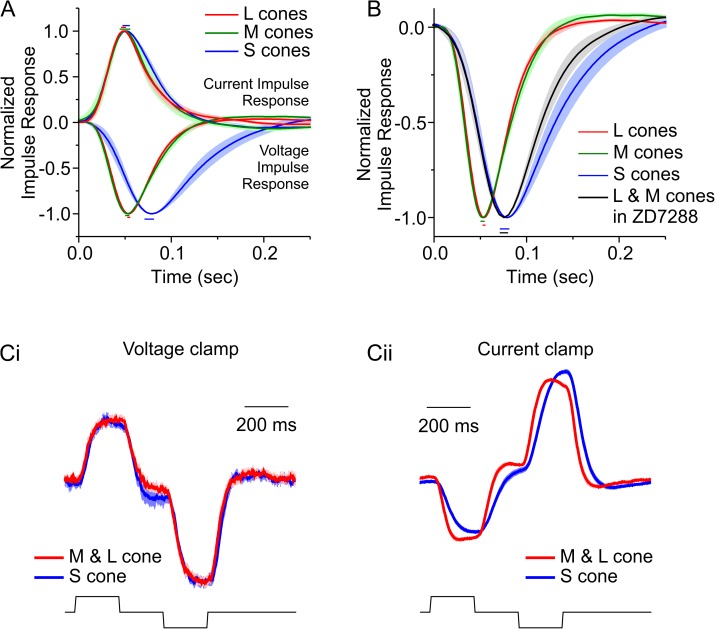
Fig 6. Comparison of light responses under the voltage- and current-clamp conditions of long-, mid-, and short- wavelength sensitive cone photoreceptors (L-, M-, and S-cones).
(A) L-, M-, and S-cone current and voltage impulse-response functions during high contrast. Current impulse responses were equal for all cone types (see S3 Table for quantification). (B) Voltage impulse responses during high contrast for L-, M-, and S-cones and for the pooled result of L- and M-cones in the presence of 50 μM ZD7288. When Ih is antagonized with ZD7288, the voltage light responses of L- and M-cones slows and closely resembles that of S-cones (see S3 Table for quantification). Panels A and B suggest that cone membrane properties (membrane capacitance) slow the light response and that voltage-gated currents such as Ih speed up the light response of L- and M-cones. Since S-cones lack a prominent Ih (Fig 5Eii), their voltage light responses remain slow. (C) When stimulated with a simple brief-light step stimulus, while the current responses of all three cone types had similar kinetics (Ci), the voltage response of S-cones was considerably slower (Cii). Panels A and B used the sum-of-sinusoids (SoS) stimulus and procedure described in Fig 3A and 3B. The L-, M-, and S-cone data are the same as shown in Fig 5B; for the ten L- and M-cones in ZD7288, the stimulus repeated 5.7 ± 0.56 times. Data for panel C were 0 to 1 normalized before averaging. All data are shown as mean ± standard error of the mean (SEM); the color-coded bars above and below the impulse-response functions indicate the ±SEM in the time to peak. The data to generate this figure can be found in S1 Data.

