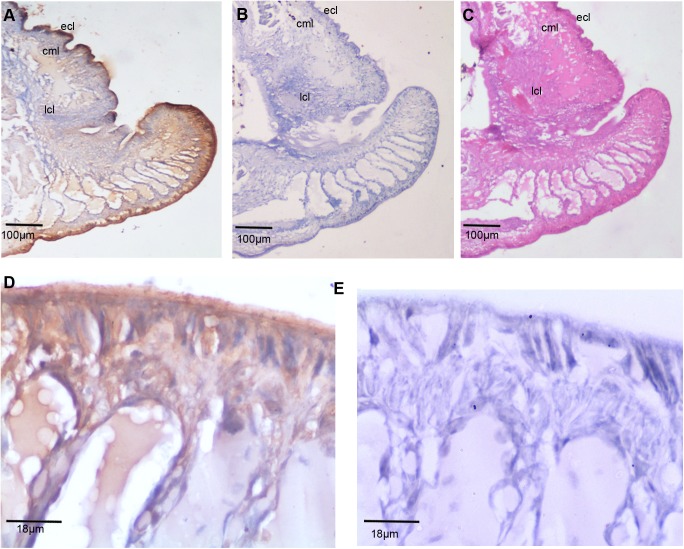
Fig 4. Expression of E. eugeniae TCTP in 3rd day regeneration blastemal.
(A) Immunohistochemistry with anti-TCTP antibody using the 3rd day regeneration blastema. It shows abundant expression of TCTP at the blastemal region (B) The pre immune serum treated sections used as a control, it didn’t show the signals. (C) The consecutive section of IHC sample was stained with eiosin and haemotoxylin. (D) 40X Magnified image of panel A shows the rich expression of TCTP protein in the blastema. The tip of the blastema shows maximal the expression of TCTP. (E) 40X magnified image of Panel B, show no positive signals.

