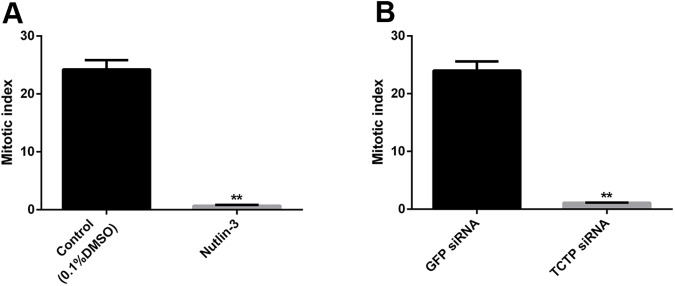
Fig 12. Mitotic index.
(A) Mitotic index of the nutlin3 treated and control 0.1% of DMSO injected worms. It shows significantly low mitotic activity at the nutlin3 treated sample. (B) Mitotic index of the TCTP siRNA injected and control GFP siRNA injected worm, it shows significantly low mitotic activity at the TCTP siRNA sample. The values were given are mean ± SEM; **p <0.005

