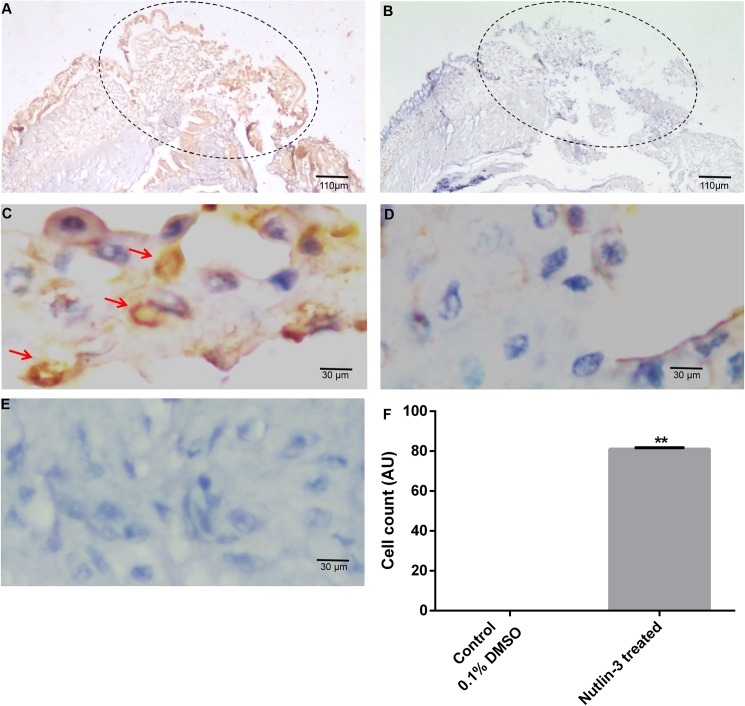
Fig 13. Tunnel assay.
(A) 4X image of tissue section of worm administrated with nutlin3 and subsequently subjected to tunnel experimental. The brown cells are apoptotic cells (B) 4X image of tissue section of worm administrated with nutlin3 and subsequently subjected to tunnel experimental without the enzyme terminal transferase. The brown cells apoptotic cells are not observed. (C) 100X Magnified image of panel A, the nuclear signals noted in tunnel positive cells. (D) 100X Magnified image of panel B. (E) 100X image of 0.1% DMSO injected worm tissue shows no tunnel positive cells (F) The graph shows the significant difference in the apoptotic cells in the nutilin-3 and DMSO injected worms. The values were given are mean ± SEM; **p <0.005

