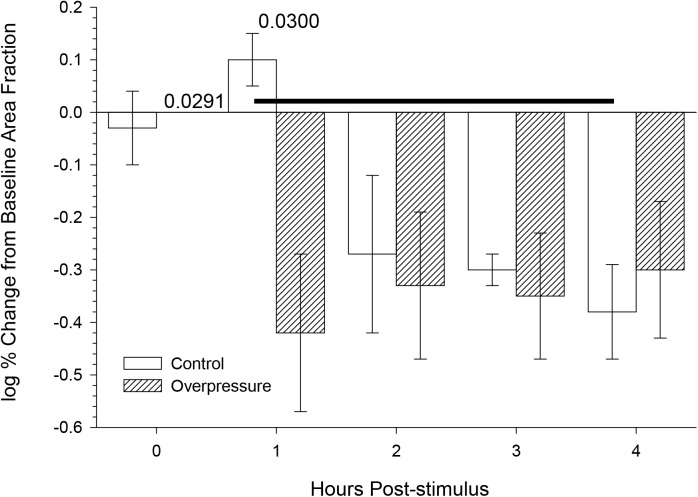
Fig 4. Neither overpressure nor incubation time showed significant main effects on area fraction of GFAP immunoreactivity.
Mean ± s.e.m area fraction of GFAP immunoreactivity as a function of incubation time. N within the bars indicates the slices used to collect the data. Each slice contributed to an average of 25 image fields. Main effects (overpressure, incubation) and interactions were tested in a general linear model (SAS Proc GLM) and none were significant. Post hoc comparison P values denote significant differences between bar pairs, or bars linked by horizontal line.

