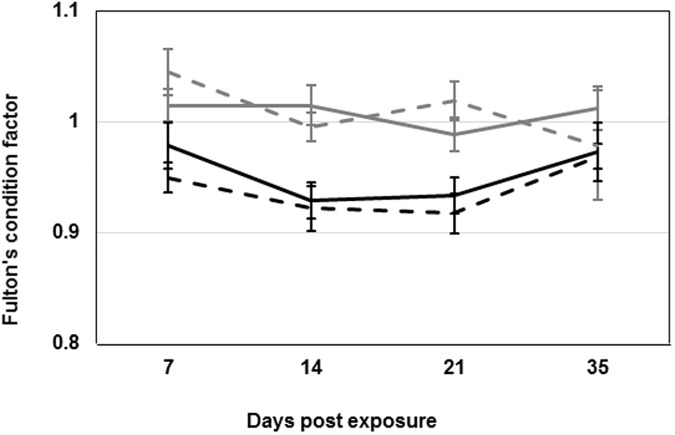
Fig 2. Condition factor.
Fulton’s condition factor calculated by: 100 × weight (g)/ [fork length (cm)]3 for all fish sampled at all time-points. Lines represent the average ± SEM per group. Black lines represent triploid groups and grey lines the diploid groups. Dashed lines represent control groups.

