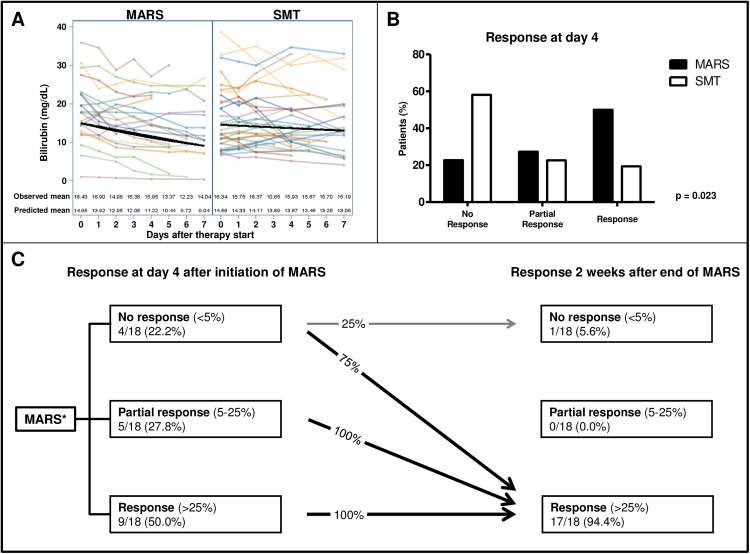
Fig 2. Patients with acute liver injury: Course of bilirubin values and response to MARS treatment in the short term and 2 weeks after the end of MARS therapy.
(A) Course of bilirubin values during the first week of therapy (MARS: 22 patients, SMT: 31 patients). (B) Response classification at day 4 of therapy (No response vs. Partial response vs. Response) was based on the calculated bilirubin reduction and compared to the bilirubin baseline value. (C) Corresponding response classification two weeks after the last MARS session. * Patients with liver transplantation or missing data at follow-up or those who had died were excluded from this analysis (in total, 4 patients).

