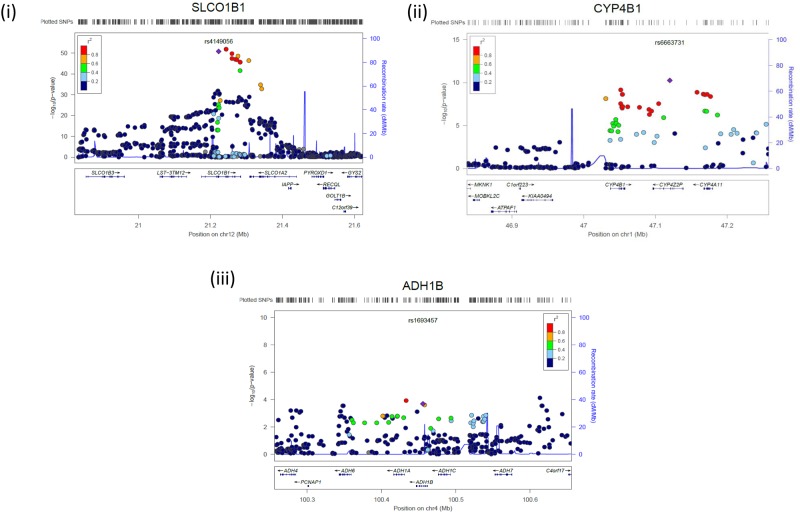
Fig 3. Association plot of the genomic region around (i) SLCO1B1, (ii) CYP4B1 and (iii)ADH1B showing both type and imputed SNPs with location of genes and recombination rate.
P values of SNPs are plotted (as −log10 P) against their physical position on the chromosomes (NCBI Build 36). Estimated recombination rates from the HapMap CEU population show the local LD structure. The color of each SNP indicates linkage disequilibrium with the index SNP (rs4149056 or rs6663731 or rs1693457 respectively) based on pairwise r2 values from HapMap CEU data.

