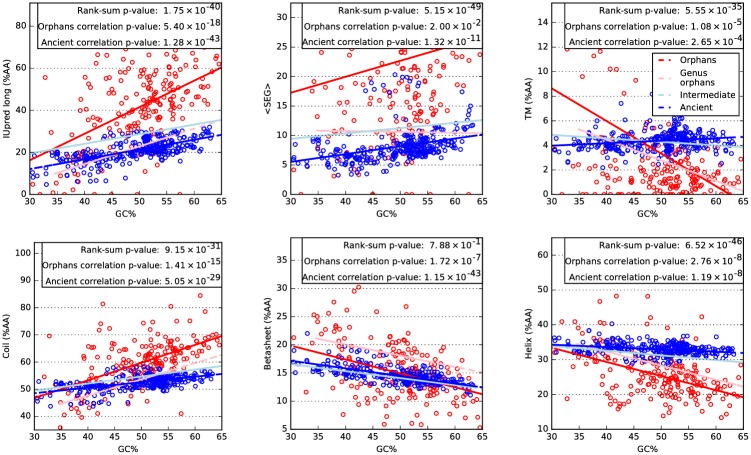
Fig 3. Structural properties of proteins of different ages plotted against the GC content of the genome (coding regions).
For clarity only the ancient (blue) and orphan (red) proteins are shown individually, but the linear fitted lines for genus orphans (pink line) and intermediate ones (light blue) are also shown. In the text box three values are presented: rank-sum p-value = p-value of a rank-sum test of orphans versus ancient (only the property on y axis is considered); correlation p-values = p-value of a linear regression test for orphan and ancient.

