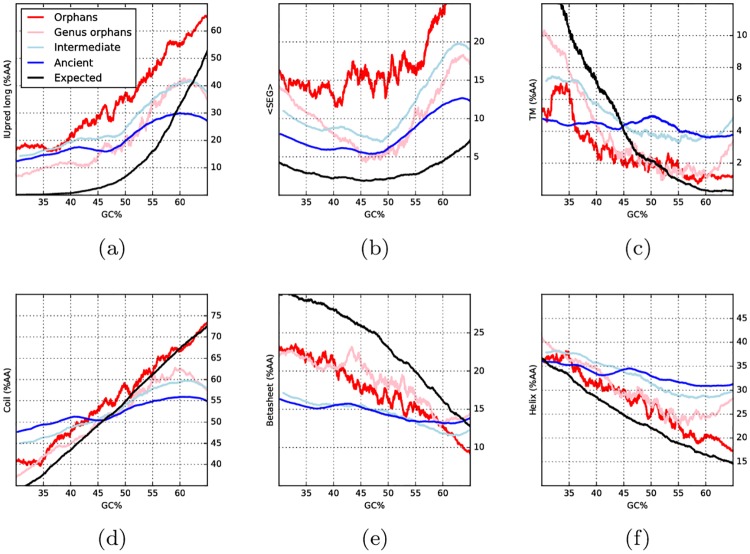
Fig 4. Running averages of predicted structural properties against GC content: (a) disorder, predicted by IUpred (long); (b) low complexity, predicted by SEG; (c) percentage of transmembrane residues predicted by Scampi; (d,e,f) percentage of residues in secondary structure of type, respectively, coil, beta sheet and alpha helix.
For each property, colored lines represent proteins of different age: orphans (red), genus orphans (pink), intermediate (light blue) and ancient (blue). The black lines represent randomly generated proteins at different GC frequencies.

