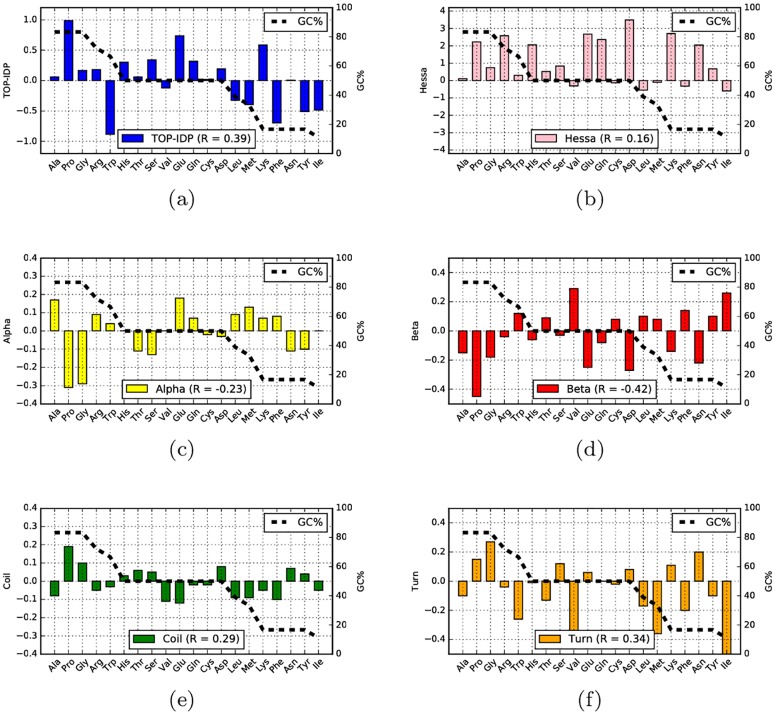
Fig 7. The fraction of GC in all codons encoding an amino acid is plotted as a dotted line and the values for the different propensity scales as filled bars: (a) TOP-IDP, (b) Hessa transmembrane scale, and (c-f) Koehl secondary structure preference scale.
For each scale the Pearson (R) correlation with GC is also shown.

