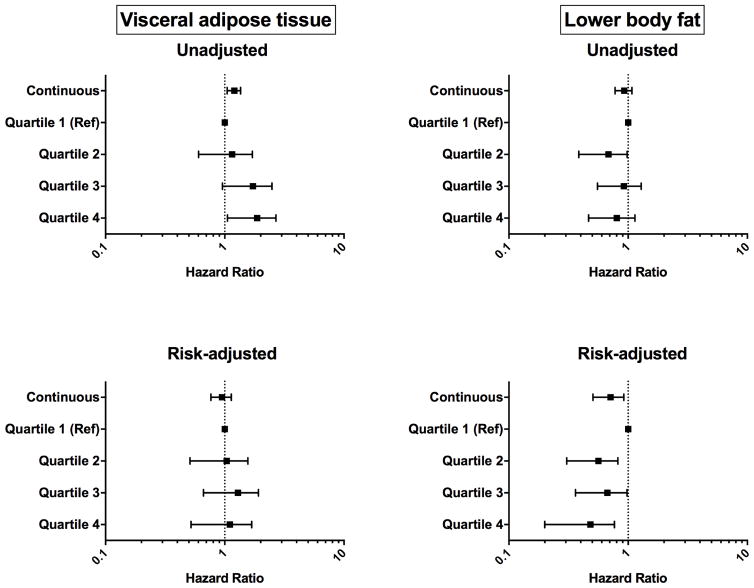
Figure 2.
Forrest plot of the graded risk for incident cancer per 1-unit standard deviation increase in visceral adipose tissue and lower body fat, before and after adjustment for clinical and demographic variables. Model is adjusted for sex, race, age, smoking status, alcohol use, family history of cancer and body mass index. Data is given as hazard ratio (95% confidence intervals).

