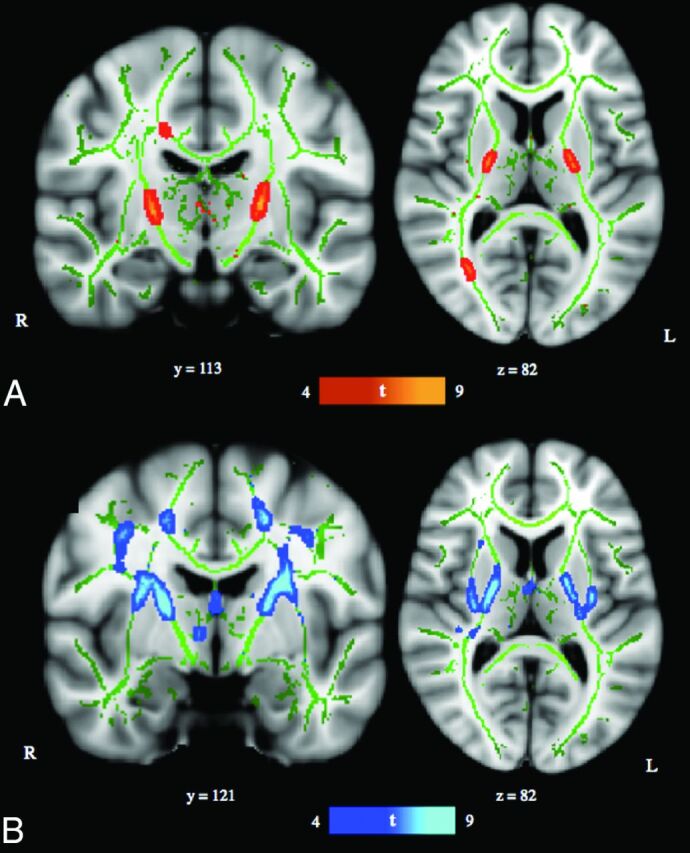
Fig 1.

TBSS results. A, TBSS-derived t-map of decreased fractional anisotropy in the anoxic brain injury group relative to the neurotypical control group is shown in red-yellow (P < .001, corrected for multiple comparisons). B, TBSS-derived t-map of increased mean diffusivity in the ABI group relative to the neurotypical control group is shown in blue–light blue (P < .001, corrected for multiple comparisons). Results were thickened with tbss_fill and are overlaid onto the study-specific white matter skeleton (green) and the Montreal Neurological Institute–152 template. Section position (given by y or z location) corresponds to Montreal Neurological Institute–152 template space.
