Fig 2.
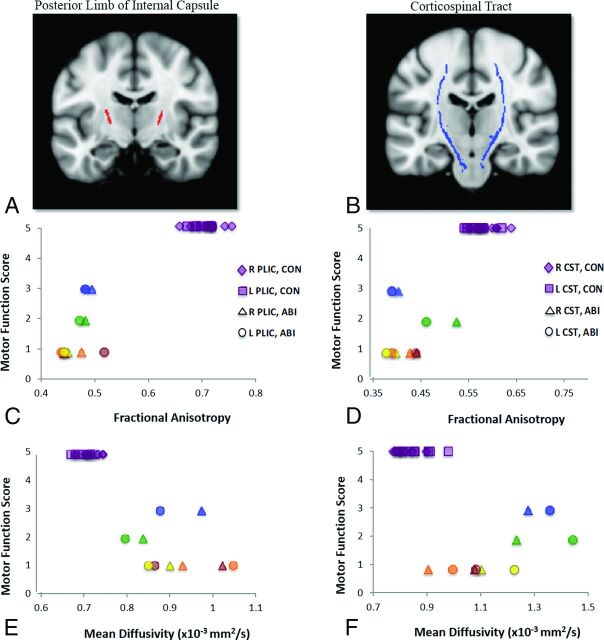
Motor function scores versus diffusion indices. Scatterplots of per-subject motor function scores versus per-subject mean fractional anisotropy and mean diffusivity values from ROI analyses of the right and left posterior limbs of the internal capsule (A, red) and the right and left corticospinal tracts (B, blue) are shown. Motor scores are derived from our functional assessment forms, PLIC ROIs were derived from clusters in our TBSS analysis of FA data, and CST ROIs were derived from the Johns Hopkins University white matter tractography atlas. ABI patient data are color-coded per subject for bilateral PLICs and CSTs: Blue indicates patient A; green, patient B; yellow, patient C; orange, patient D; red, patient E. C, Motor function scores versus FA, right and left PLICs. D, Motor function scores versus FA, right and left CSTs. E, Motor function scores versus MD, right and left PLICs. F, Motor function scores versus MD, right and left CSTs. Analysis of FA data in the bilateral PLICs demonstrates the strongest between-group effects (at the individual subject level), fully differentiating control (CON) and subjects with anoxic brain injury.

