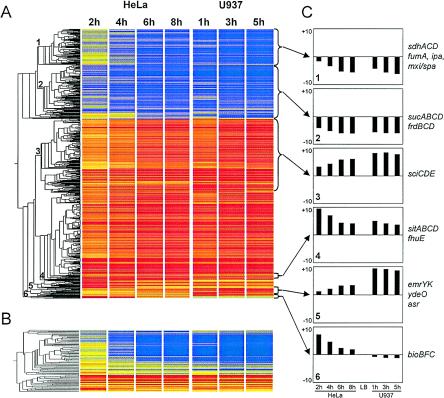
FIG. 2.
Gene expression profiles for Shigella during infection of HeLa and U937 cells. (A) Cluster diagram of the expression profile of 1,256 chromosomal genes showing statistically different levels of expression during infection of HeLa or U937 cells relative to the data for the reference LB culture. Each horizontal line represents one gene. Red indicates at least a twofold increase, yellow indicates no change, and blue indicates a minimum twofold decrease in expression. (B) Cluster diagram of the expression profile of 80 plasmid pCP301-borne genes. Hierarchical clustering was performed by using Genespring 6.2 with the Pearson correlation. (C) Average relative levels of expression of representative clusters. The vertical axis shows the fold change in expression for each gene on a logarithmic scale. Examples of genes corresponding to the various profiles are given.

