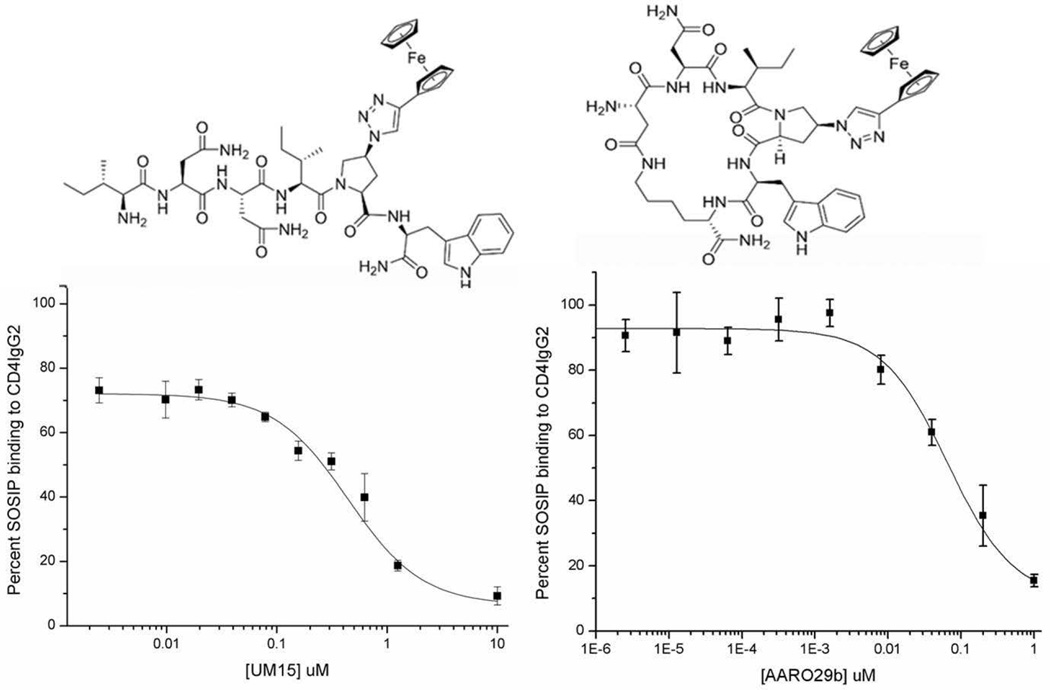
Figure 2. Comparison of peptide 1 (Left) and peptide 2 (Right) structures and competition of CD4IgG2 binding to SOSIP.
Top: Structures of 1 & 2. Bottom: Dose response curves for Peptides 1 and 2 determined from the effect of BG505 SOSIP.664 interaction with CD4IgG2 via ELISA (n=4). The IC50 values of peptides 1 and 2 for CD4IgG2 binding were 442 +/− 2.25nM and 75 +/− 1.2 nM, respectively.

