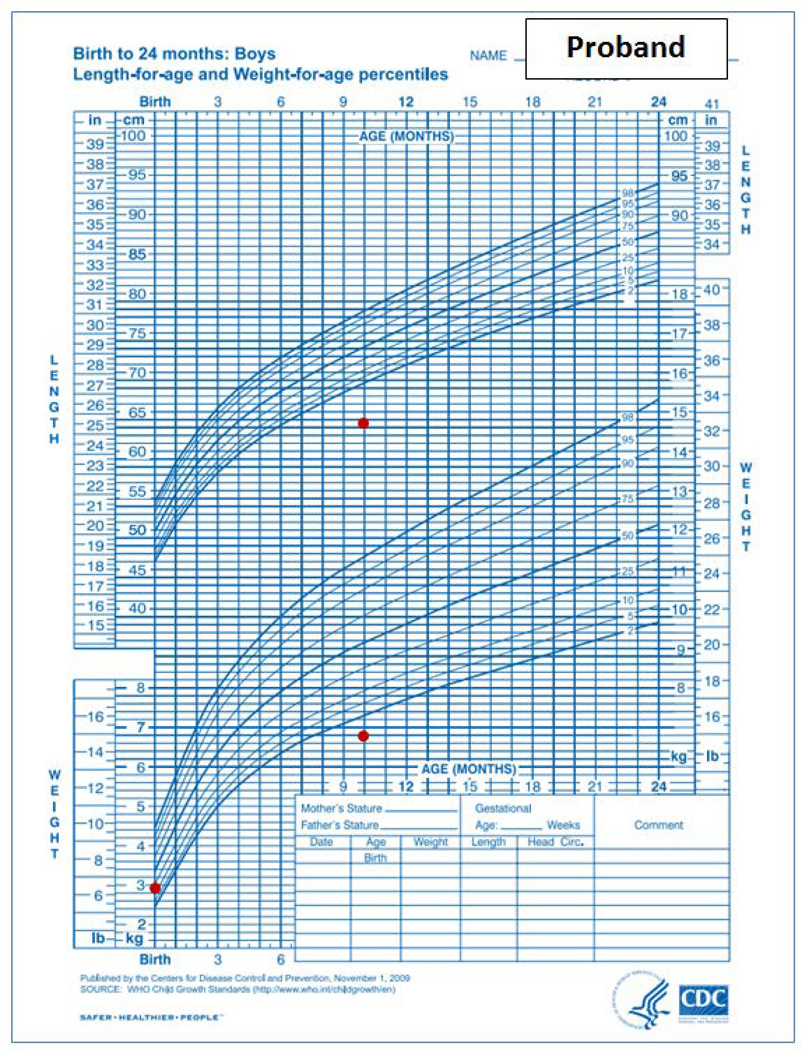
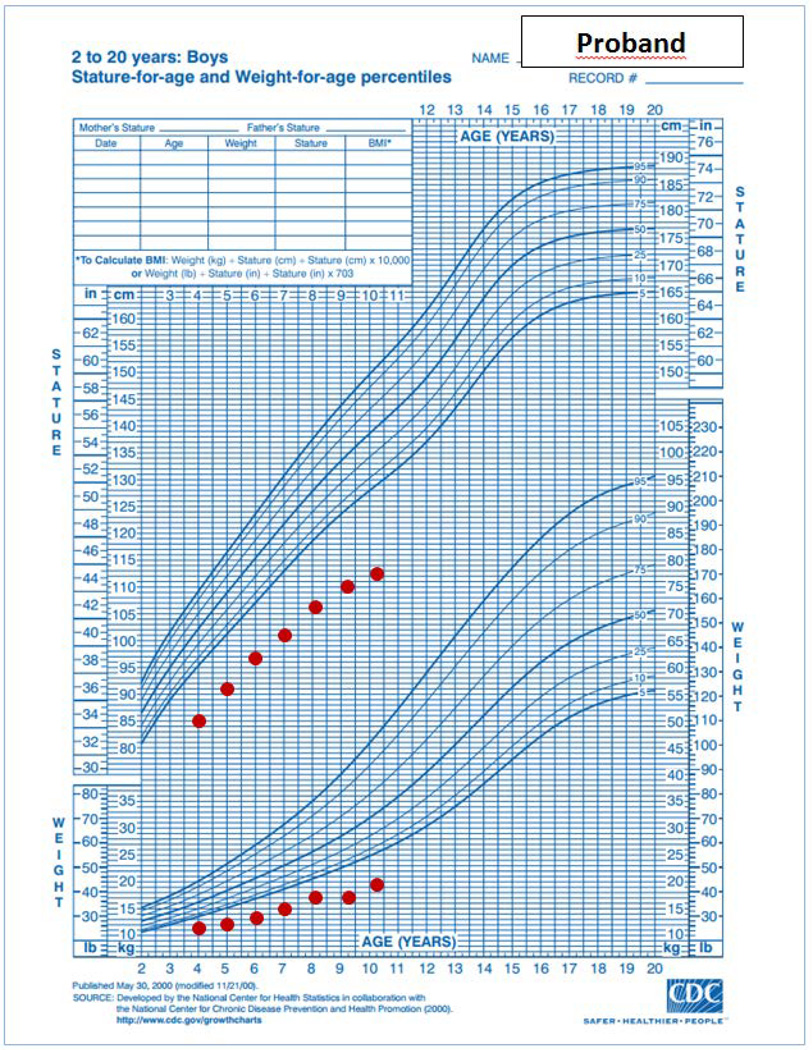
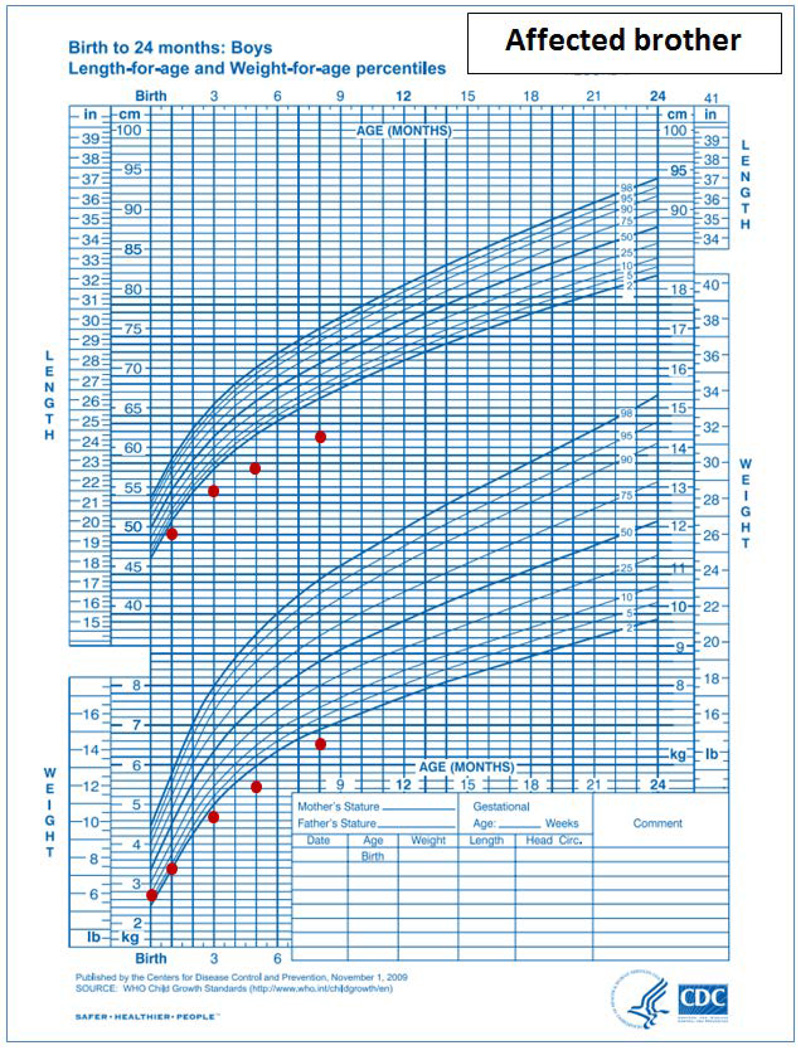
Figure 2.
A, B and C. Growth charts of proband and his affected brother. The proband’s growth charts showed impaired linear growth causing progressive deviation of the height from the normal range through infancy and childhood. 2A: infantile growth chart (0–2 years). 2B: childhood growth chart (2–20 years). 2C: Affected brother’s growth chart shows pre- and post-natal growth deceleration. Both growth charts are based on normative data from the Centers for Disease Control and Prevention, National Center for Health Statistics, United States, http://www.cdc.gov/growthcharts/.


