
Figure 1.
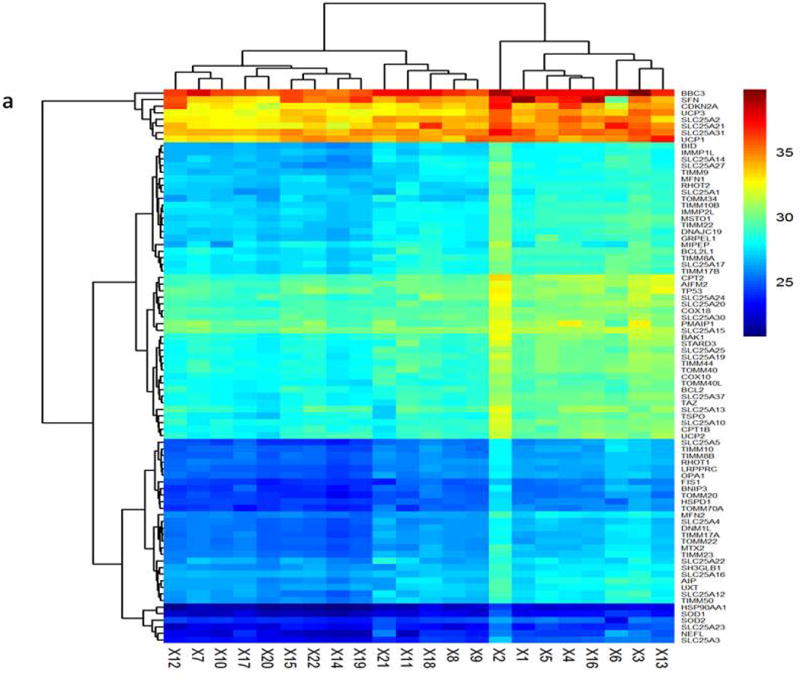
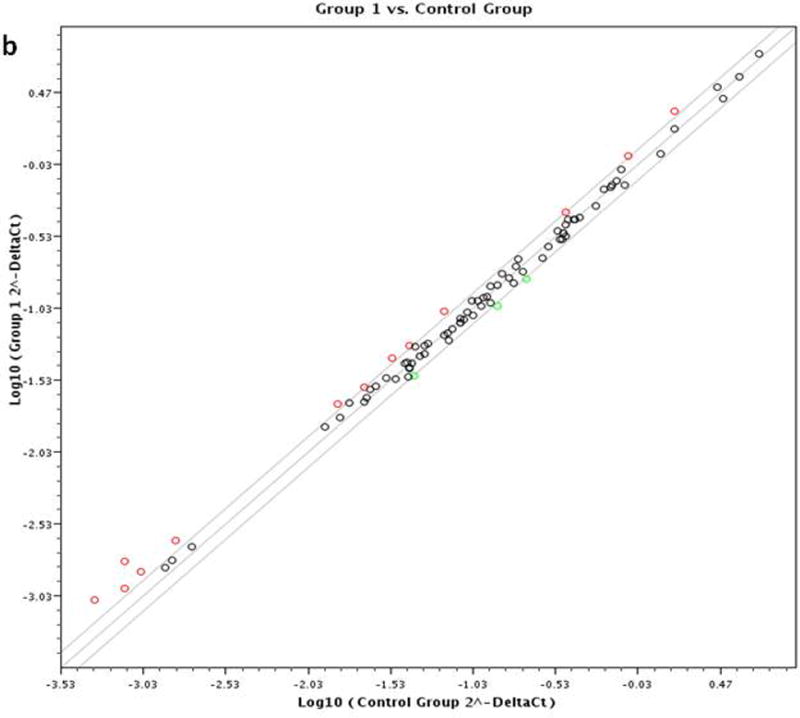
Figure 1a: Hierarchical clustering analysis of mitochondria gene expression profile in MDD and control subjects. Each row represented different sample, each column represented different genes. Red represents high Ct value with low expression. Blue represent low Ct value with high expression. Figure 1b: Scatter plot based on the fold change of each gene. Group 1 means MDD Group; Control means healthy control.