
Figure 3.
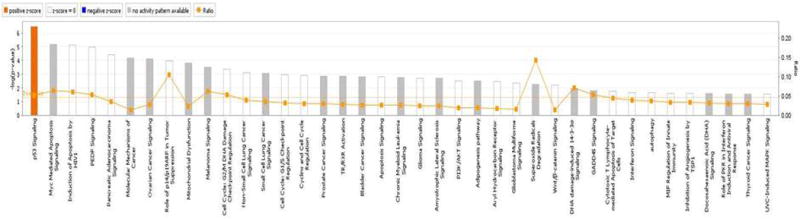
Canonical pathway analysis of genes differentially expressed in dlPFC of MDD subjects. The line represents the ratio of the number of genes represented within each pathway to the total number of genes in the pathway.
Official websites use .gov
A
.gov website belongs to an official
government organization in the United States.
Secure .gov websites use HTTPS
A lock (
) or https:// means you've safely
connected to the .gov website. Share sensitive
information only on official, secure websites.
Canonical pathway analysis of genes differentially expressed in dlPFC of MDD subjects. The line represents the ratio of the number of genes represented within each pathway to the total number of genes in the pathway.