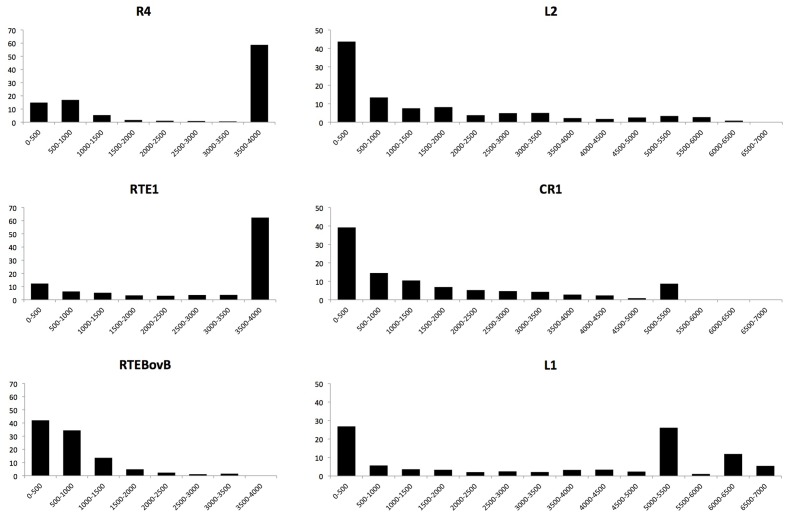
FIGURE 1.
Length distribution of polymorphic LINE insertions. The majority of R4 and RT1 insertions approach full-length, while all other LINEs were primarily found as truncated copies. Note that the L1 clade has multiple subfamilies whose full-length copies vary in length and this results in the multiple peaks at the right of the length distribution.

