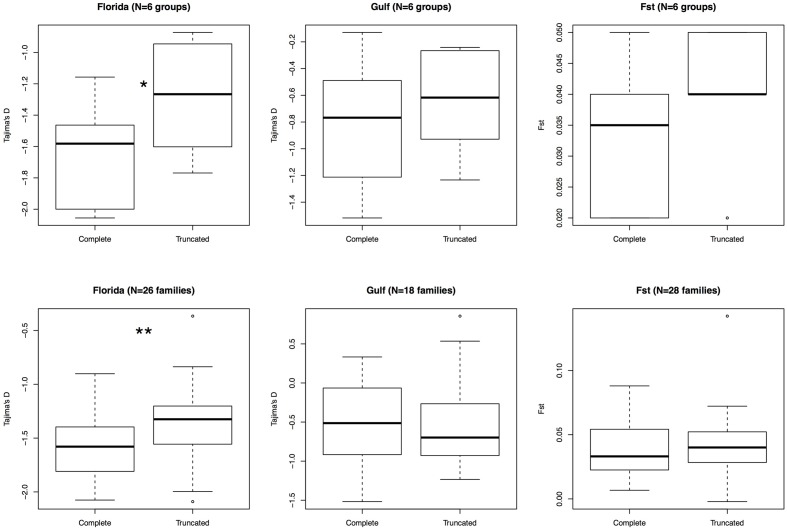
FIGURE 3.
Comparison of variation between truncated and complete elements. Six groups were considered: L1 (families AC1 to 16), L1 (families 17 to 20), L2, R4, RTE-1, and CR1 (top row). A more detailed analysis comparing all families within clades is also displayed (bottom). Only polymorphic families with at least 10 polymorphic sites in a population were retained. Wilcoxon signed rank test; ∗P-value < 0.05, ∗∗P-value < 0.01.

