
Figure 2.
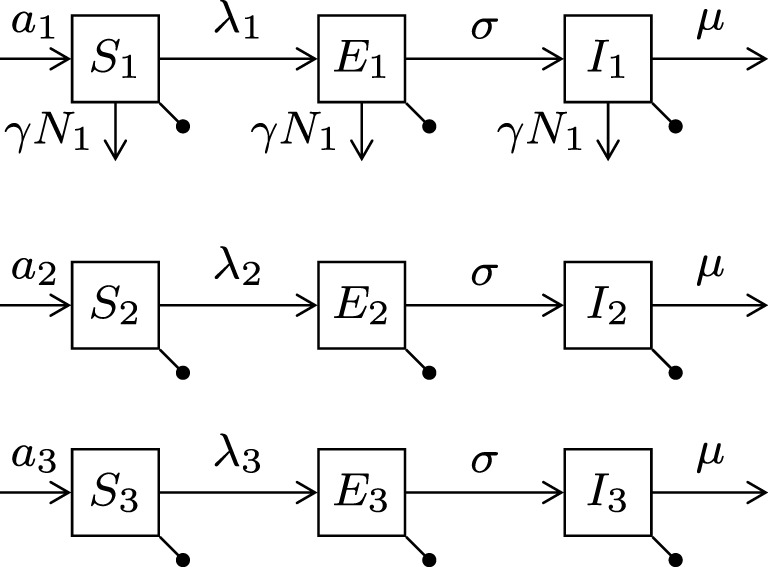
Diagram of the canine rabies model with three dog ownership types. Type i = (1, 2, 3) represent stray dogs; owned free-roaming dogs; and owned confined dogs, respectively. The bullets represent the natural death rates bi. Infection of susceptible dogs occurs at a rate λi = βi1I1 + βi2I2 + βi3I3, also known as the force of infection. Stray dogs (type 1) face an additional density-dependent mortality at rate γN1. See Table 1 for parameter meanings.